The US Treasury Yield curve inverted today for the first time in more than a decade. The yield on the 10 year bond has fallen below the yield on the 2 year bond. This is generally considered an important consequence of economic policy and slowing growth.
The consensus is that it generally precedes recessions. Our question was, how do stock returns perform once this signal has been triggered?
The Graph below is the 2/10 Yield curve since 1975.
Please Note :
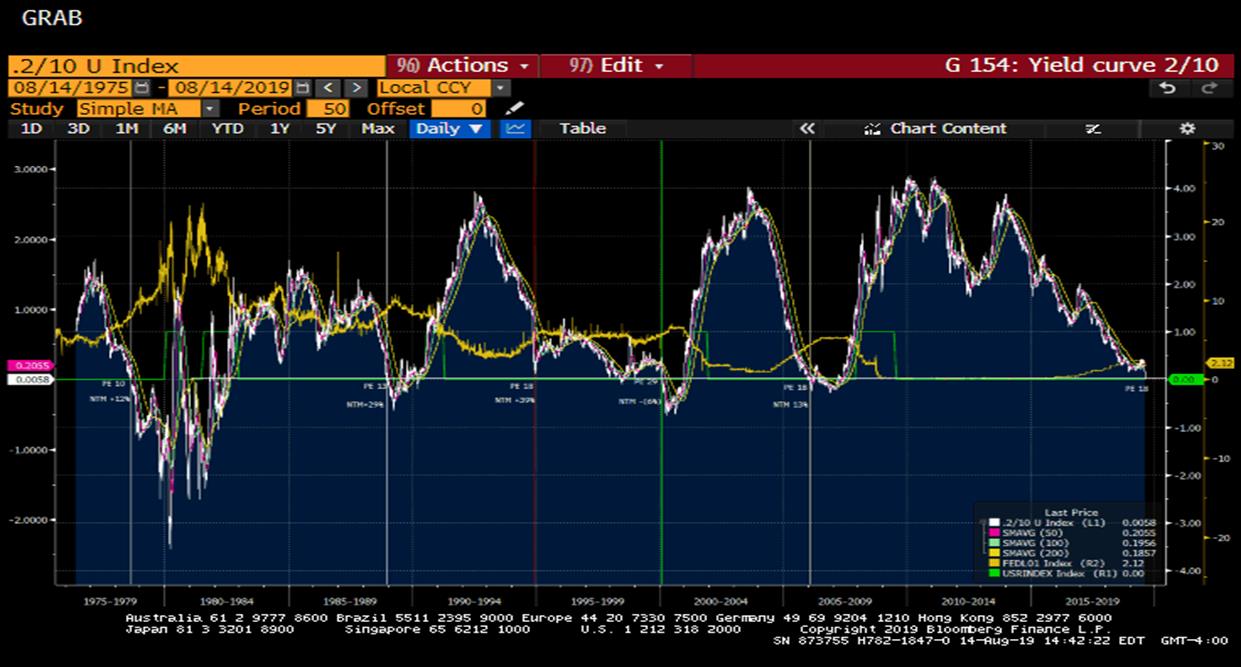
(White Line is the 2/10 Curve)
(The horizontal green line is the Zero line for the curve)
1.The Fed Funds rate(yellow) was STILL RISING post ALL of these points of inversion(vertical lines).
2.Also note that the 1 year return for the S&P 500 was materially positive in all NTM periods except in Y2000.
3.The same follows for the Next 2 Year returns, again except for Y2000 where the market was down a total of 20%.
4.The PE multiple in the 1994 period is exactly where it is today, at 18. The NTM was +39% and the 2 YR return was a whopping 67%.
5.The Fed Funds rate (yellow) has risen through the inversion in all cases except the current one. The shows how the FED tends to be late.( there is an overall take here that shows how the FED appears to cause all of these inversions (and economic problems) in the first place.
6.Finally, we see that actual recessions(green line) have all begun more than a year after the inversion and generally BEFORE the FED begins cutting rates
*NTM S&P 500 Returns:
8/30/78 : 12%
12/19/88 : 29%
12/14/94 : 39%
2/10/2000 : (-6%)
1/30/06 : 13%
**2 Year S&P 500 Returns Post Inversion:
8/30/78 : 32%
12/19/88 : 28%
12/14/94 : 67%
2/10/2000 : (-20%)
1/30/06 : 32%
***S&P PE at time of Inversions:
8/30/78 : 10
12/19/88 : 13
12/14/94 : 18
2/10/2000 : 29
1/30/06 : 18
Current :18
***Dates approximate to the inversion
Graphics courtesy of Bloomberg, LLP
Intellectus is a proud member of the CityWire Future 50 RIA group of leading RIA's.
![]()
Comments