Over the past week, financial markets revisited the “Trump Trade” as a portfolio consisting out of 3 variables. The first variable is the dollar. The green buck resumed strength because of a more favorable stance by President Trump in trade discussions with Japan and China. Japanese Prime Minister Abe praised Trump for his business qualities with a trade deal potentially away from the Trans-Pacific Partnership (“TPP”). The conference call with Chinese President Xi Jinping resulted in a policy shift by Trump when he formally confirmed to uphold the “China One Policy.” The diplomatic nature of these discussions with Japan and China critically refrained from “currency manipulation” and was rather translated as a “level playing field” on currency valuation. The dollar index re-priced to moderately above 100, an important level to watch how Trump trade policy unfolds.
The second variable is the U.S. stock market. The Dow and S&P made new highs driven by two key news facts. The first fact is President Trump said a comprehensive tax plan would be ready “in the next 2 to 3 weeks.” The second fact is Fed Board member Daniel Tarullo announced his resignation well ahead of his term expiring in 2022. Tarullo has been instrumental in financial regulation and oversight, and his resignation was seen as a sign of a shift towards looser financial regulation by the Trump administration. Markets like deregulation and lower corporate taxes because it lowers the profitability hurdle and expand earnings multiples.
The third variable is the Treasury bond market. Government bonds are currently wedged between two developments. On the one hand Trump policy and how it positively or negatively evolves into global fiscal expansion. On the other hand, the developments in Europe regarding election rhetoric in France on an exit of the Euro by Marie Le Pen (dubbed as “Madame Frexit”) and frigid discussions between Greece and the Euro Group, had European government bonds on edge. Treasury yields have however moved back into the 2.4%-2.5% range, mostly driven by Trump policy positives by shrugging off European negatives.
What results from these three variables is “Trump Trade” expressed as a total return index portfolio. Figure 1 shows the Trump Trade since he made his Presidential election bid official in 2015. Since then the return on the Trump trade portfolio closely followed the MSCI World Index and has now a cumulative 13% gross return. Post Presidential election, the Trump Trade saw some fading albeit the MSCI index rose further (see oval Figure 1). That suggests one positive: as Trump trade policy's negatives (tariffs, protectionism) are de-emphasized, the global economy benefits and hence why the MSCI World Index rose.
Investors can gauge the Trump Trade by looking at the weighted index return portfolio at a “parity level”: dollar index at 100, Dow at 20K and 10-year Treasury yield at 2.5%. At those levels the Trump Trade is at a "level playing field." Any deviation of the index return portfolio to the downside, and the negatives of Trump policy dominate. Any significant to the upside of the index return portfolio, and the positives have the upper hand. As it stands, the market remains in the margin of error between the positive and negative side of the Trump Trade. This is why likely topics like the European elections, Greece, Iran, and Fed Minutes will start to matter. Those factors can compound the Trump Trade in either direction, which why the Trump Trade is likely to stay a dominant return attribution for the rest of this year.
Figure 1
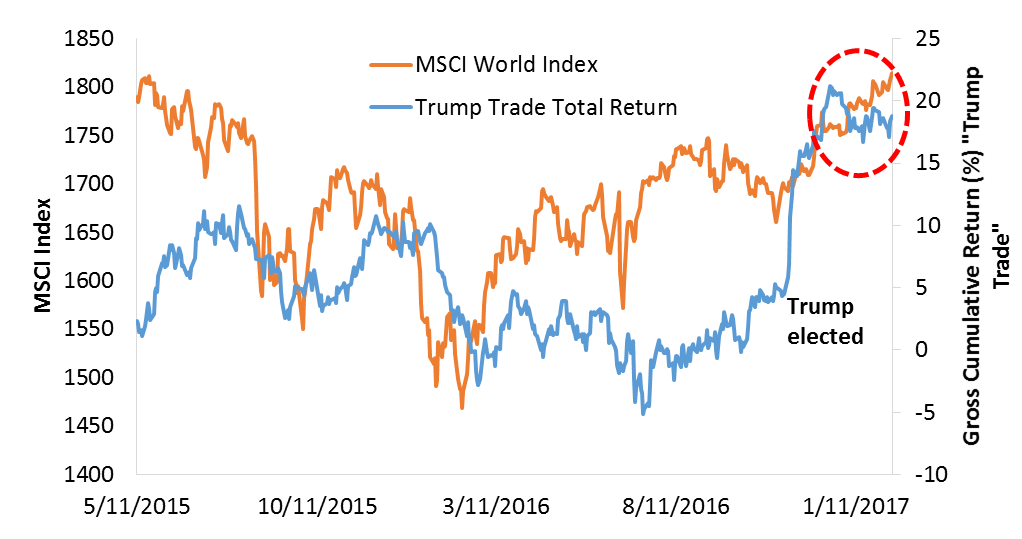
Source: Bloomberg. Trump Trade = total return portfolio of equally weighted positions (30% each) in the Dollar Index, Dow Jones Index future and 10-year Treasury note future.
Comments