Global Bonds are clearly in a bubble.
It has been said that a bubble cannot be a bubble unless there is greed and speculation. How could that be the case in the Government bond market?
Below is the graph of the TLT ETF, which tracks the price of the 20 YR Treasury bond Index. Note the comparison in the rate of change to that which happened in the real crisis of 2008-09. Generally speaking markets accelerate near the beginning and the end of a major move. This is clearly not the beginning. Even in 2008-09 it is hard to argue that the parabolic move was predictive of the economic situation. This is because the move did not really begin until November of 2008. Two years after the inversion and just a handful of months before the market actually bottomed.
Well, let's start with the sheer amount of government debt outstanding and the leverage that leading nations are carrying. Governments have had the luxury of "whistling past the graveyard" in issuing debt as desired and buyers just show up no matter what they spend that money on. We would not be surprised to see the US take advantage of this blind buying by issuing 50 or even 100 year Treasuries. Hopefully to implement a massive infrastructure plan. Why not, if the buyer will buy anything despite a lack of value, why not give them what they want?
We would argue that the very fact that the globe is filled with negative government yields, even with this massive supply is in fact a speculative formation. Maybe that is in fact "greed". In this case it is the supreme confidence that bond investors have that negative rates will continue unabated and that it is the only "way out" or path forward. That blind conviction is very typical in market bubbles. Maybe the "speculation" this time is not necessarily greed as we normally see it but greed and fear are two sides of the same emotion. Thus the global policy panic that has set in and pervasive negativity is driving this dynamic.
It is clear that the toxic cocktail of 1. China's slowing growth caused by structural problems stemming from their malinvestments in the 2000's 2. the risk and consequences of the Trade War, and 3. the Technology new paradigm and 4. maybe most importantly, the negative rate policy path in Europe ( and to be fair, QE in total) is what is driving down US rates.
Since the Great Recession, and the following series of European Crises(Grexit, Brexit, etc) the Europeans, led by the Germans have forced Austerity upon the continent while pursuing QE and ignoring their larger structural weaknesses. It has not worked. It has led to a decade of stagnation. Negative rates and ignoring structural problems are not pro growth. Shown in the graphic below of US(yellow) vs Eurozone GDP since 2009.
Meanwhile, the US has pursued a more liberal path towards recovery (but largely ignored structural improvement until recently) and we have in fact seen a far better recovery in the US. Unfortunately for Europe, the rise of China coincided with this and the combination led directly to the hollowing out of many of Europe's stalwart industries. The dramatic shift in consumer behavior driven by low cost products from China crushed industries across the continent. From High end shoes & clothing in Italy to Cars and appliances in Germany, China has compressed margins and changed consumer behaviors.But more on this in another post.
So, that is why this week's news that the Germans are considering new fiscal stimulus, in fact, deficit spending (if they see a recession) as very welcome news. A more pro-growth policy is required in Europe and is exactly what the Germans have been avoiding. In fact, it is possible that this type of structural shift in Fiscal policy in Europe is what could be the pin to prick the negative rate bubble and the blind conviction in QE induced negative rates. If they will not reform their corporate and economic policies to allow corporations to be more competitive, at least more pro growth capital spending will help in the short run.
Most importantly, Germany has the room to do so as the graph below shows how their debt as . a % of GDP has been falling since 2010. This even while their GDP growth has been very slow.
We apparently have had an anomaly in the bond market in that the 10 year yield has consistently been yielding far below nominal GDP growth. So, one could argue that the bond market is no longer predictive of US growth rates post QE. But, it may be telling us that policy is too tight. As Lawrence McDonald from Bear Traps reports posted, from 2017-19 there has been $4.5T of tightening vs the previous period from 2012-16, where we saw 1.7T of easing. So, the markets may be screaming for an easier policy and the FED may indeed be late again.
Or could the signal be a bubble in uncertainty, or fear? This has some merit. Based upon the Chicago FED Economic Policy Uncertainty Index below, there is evidence of that:
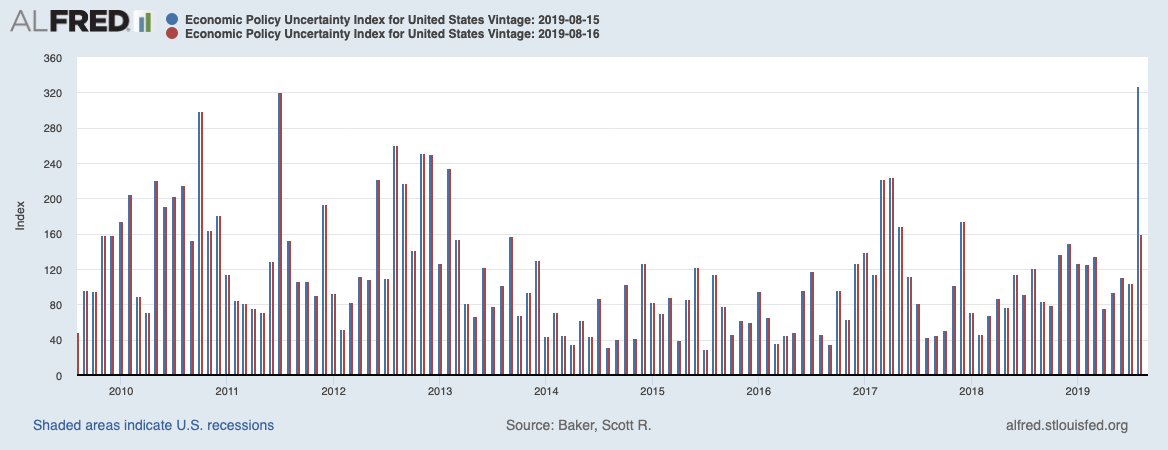
(The first series calculates an index based on the proportion of newspaper stories that discuss uncertainty, changes to tax codes, and disagreement among forecasters. The second series relates more to market sentiment by looking at newspaper stories mentioning the economy, stock markets, and (again) uncertainty specifically. The graph above shows that the two series correlate well, but aren’t in total lock-step. Right now, the first series seems to be about as high as it was during the last financial crisis, although it hasn’t spiked as high as it did in September 2008. The second series shows that the market seems a little less worried about uncertainty, but overall it’s still elevated.)
As shown by options skew in the ETF (TLT) has fallen to very low levels, where calls are very expensive relative to puts. This implies that an extreme money flow is chasing further upside (lower yields on the 20 yr bond). Extreme skew is often a contrary indicator.
This is spite of the fact that in the past week the economic news was good, despite the Trade War and the Yield Curve’s move to inversion. According to a recent Goldman Sachs report on the Overbought condition of Bonds states "In a recent Global Markets Daily, we noted that a continuation of the recent sharp yield curve flattening is likely only in a scenario where US data remain strong despite continued weakness in global data—this would preclude the Fed from pursuing a deeper easing cycle while foreign spillovers weigh down longer maturity yields. The more likely outcomes, where there is either a broad bounce (notably in Europe and China) or broad weakening (in the US) in activity data, both imply a steeper US yield curve. In the former case, this would come from a reversal of recent term premium compression, whereas in the latter, it would come from markets pricing increased odds of a deep Fed rate cut cycle—indeed, the amount of term premium compression required to offset steepening in the latter scenario is very large."
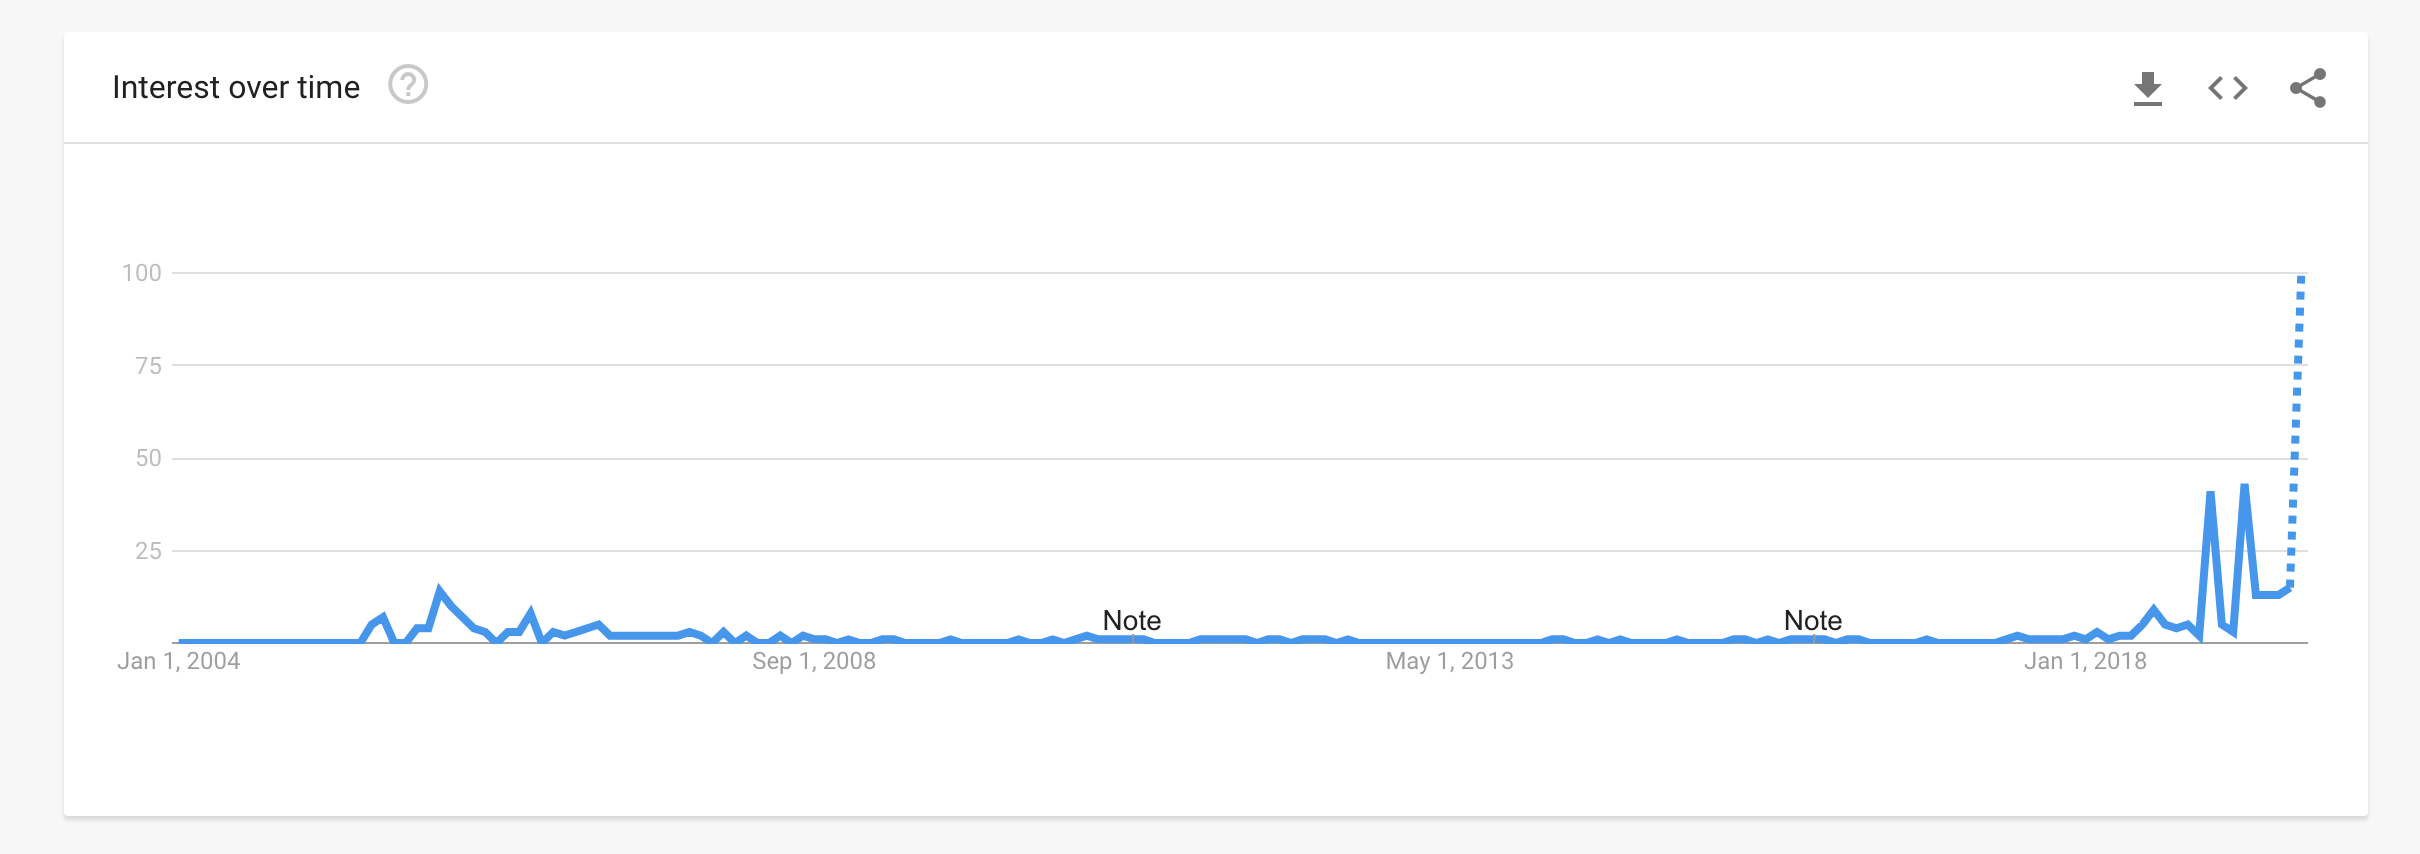
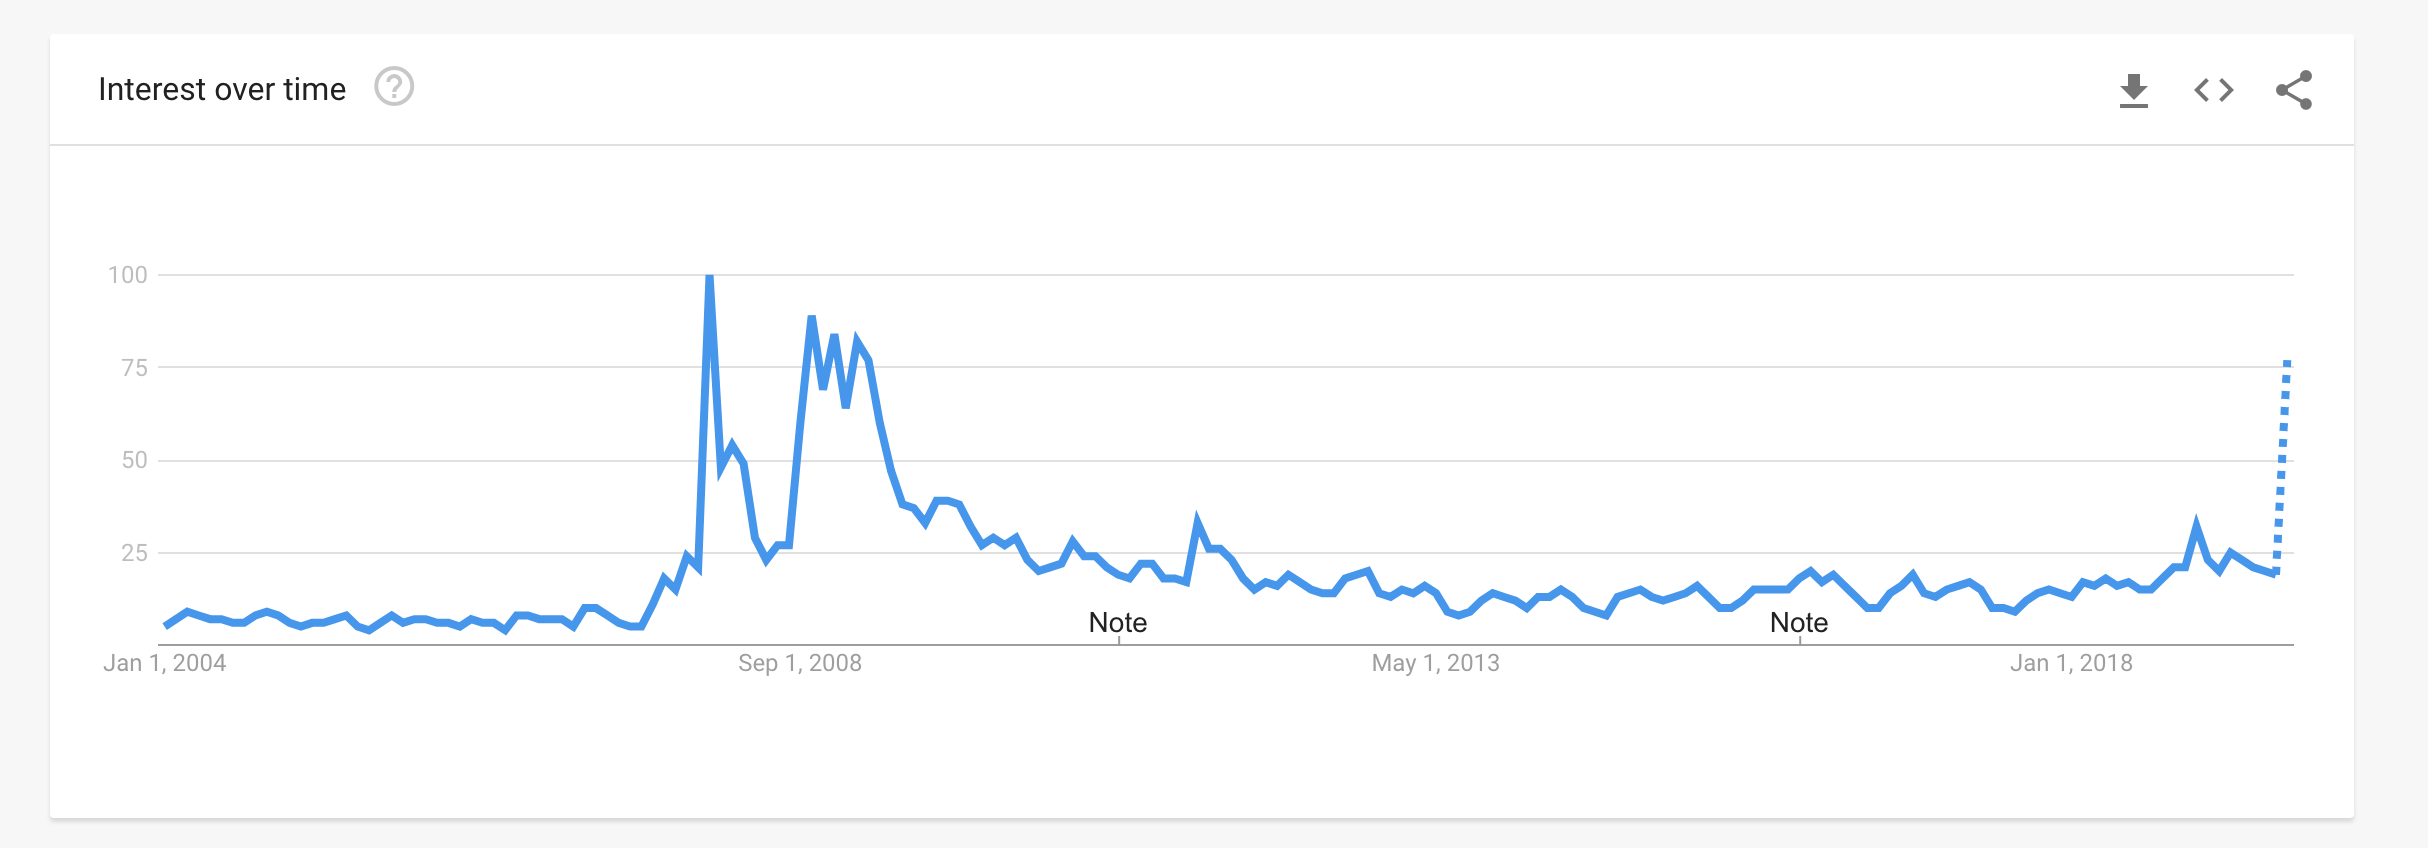
The figure below shows just how much "Main Street" focus is on the yield curve inversion. It shows far greater search interest than even in the GFC!
Based upon the The Chicago Fed’s National Financial Conditions Index (NFCI) below, conditions are actually still loose overall.
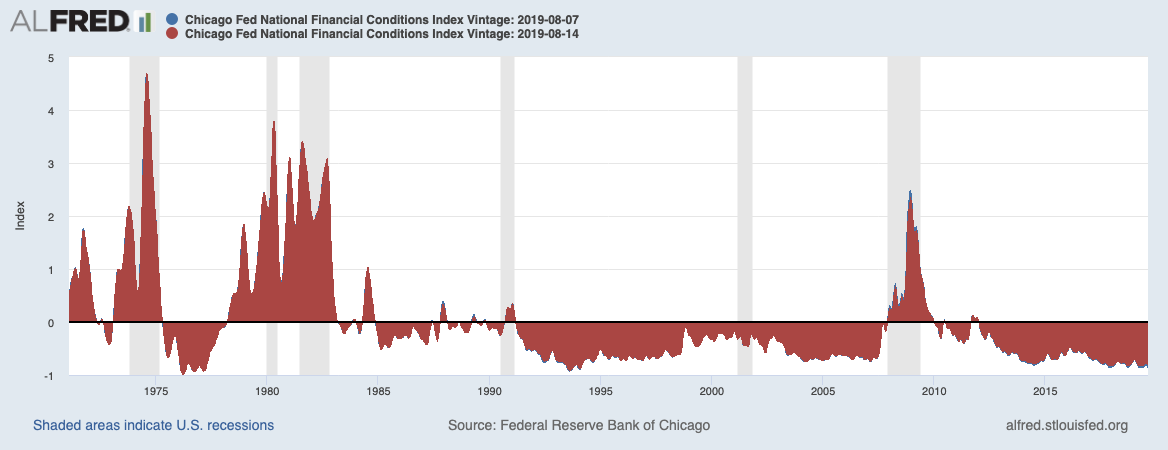
((NFCI)provides a comprehensive weekly update on U.S. financial conditions in money markets, debt and equity markets and the traditional and “shadow” banking systems. Positive values of the NFCI indicate financial conditions that are tighter than average, while negative values indicate financial conditions that are looser than average.)
Retail Sales (below) surprised again on the upside and are still strong strong. Thus supporting the view that the US consumer, with a strong balance sheet continues to be the Atlas of the world economy.
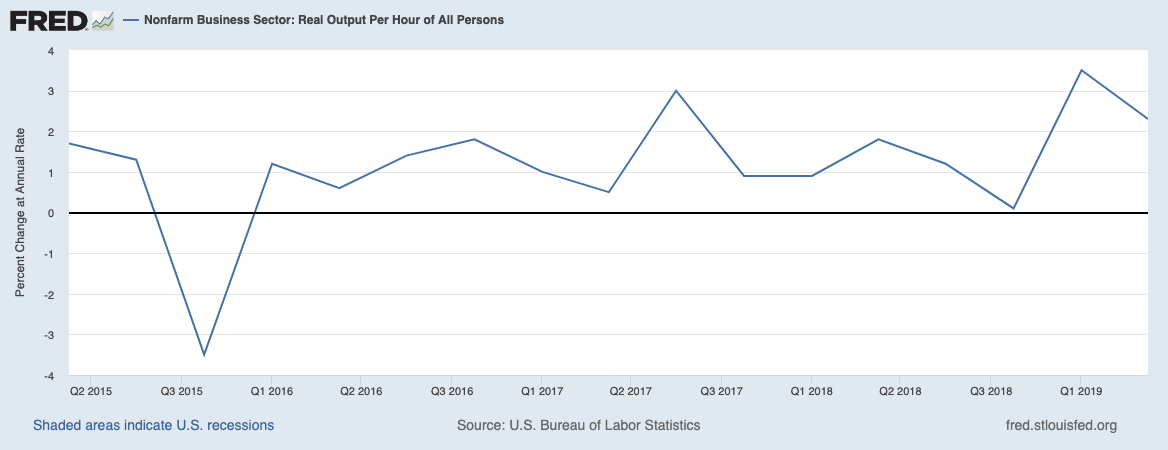
and very interestingly, stubborn productivity gains are finally surprising on the upside. We saw +3.5% in Q1 and +2.4% most recently. This is the highest in over 4 years.
Mortgage refinancing is setting records and freeing up lots of consumer capital. Even business sentiment is showing signs of stabilizing. The NFIB Small Business Optimism Index reported better conditions expected. But this was before the latest turmoil.
So, what happens if the FED does cut by 50bps at the Sept 18 meeting?
Well, in 1998 the Fed cut rates despite a 5%+ GDP economy. So, it is not unheard of to see a cut or two during economic strength. Thus, if so we’d expect yield curve steepening/stabilization to send a strong message to consumers and to markets.
Consumer confidence, which has turned down prior to the start of each recession of the last 40 years, should get a boost. However the recent market turmoil is a direct threat to consumer and business confidence. The Fed knows this and if they want things to stabilize, this is the way they can do it. Clearly, there is concern in the public about policy uncertainty as seen above and recession as seen from Google Trends data on the term "Recession" below
So, 50bp cut on 9/18 could stem that loss of confidence at about the right time. It would also quell the U.S. Dollar rally and of course reverse the inversion while potentially underpinning inflation and inflation expectations(both Fed objectives).
The Fed’s aggressively cutting rates despite the current data strength would demonstrate a welcome flexibility in thinking and puts the burden of ensuring continued growth into 2020 squarely on the White House, where they likely want it.
A possible outcome of the "Trade War" is that the fear levels are running so far and wide, that it is forcing governments all over the world (Europe, Mexico, Australia, Brazil, China, etc) to shift Fiscal and Monetary policy to offset it's expected consequences. If it turns out that the Trade negotiations are resolved in a positive manner, we will next have to deal with the flood of liquidity and easing policies put in place to offset the dynamic that never materialized. That would cause a massive position shift in global interest rates. So, reaching a Trade Deal with China, prospective German fiscal stimulus, and lower interest rates from the Fed could be enough to burst the global bond bubble and likely refocus attention on reward over risk.
*Graphics courtesy of Bloomberg, LLP
Comments