One of the key data releases next Thursday will be the first reading for Third Quarter U.S. GDP. GDP has been a “hot” topic of debate at the recent Boston Fed Conference as well as during the third Presidential Debate. The slowness of GDP has been worrisome, especially because despite a robust labor market, wages have lagged. If GDP stays slow, a tight labor market with modest wage growth may decelerate consumer spending. With an already fragile investment, trade and fiscal spending, a drop in consumer spending could “tip” U.S. GDP closer to zero growth. The dangerously slow pace of 1.3% in Q2 2016 could reverse however if consensus Q3 forecast of 2.5% annualized change is realized. The year on year slide in GDP may level out at 1.4%, which means it takes only a small acceleration to see a return to a healthier pace of growth.
Figure 1 shows this by plotting actual GDP (included Q3 forecast), GDPNOW Index by the Atlanta Fed that measures GDP "real time", and the historical rolling GDP forecast by street economists. Currently, actual GDP and GDPNOW are above the consensus forecast. The last time this happened was early 2013 when the fiscal sequester (expiring tax cuts and spending cuts) began to fade. The subsequent quarters saw U.S. GDP return to “old normal growth” of 4% to 5% real annualized (see blue line in Figure 1 during 2013-2014). Could the return to old normal growth happen again this time around?
To analyze GDP, an economist would look at the sum of the parts. GDP is an accounting based measure of consumption, investment, government spending and net exports. Recent trends in the GDP components has seen robust consumer spending of 4%, gross private investment by an average of -8%, government spending subdued at -0.3% and net exports at 1.5%. The sum produces an anemic GDP growth of less than 1.5% annualized. Forecasts show consumption is to remain at brisk 4.6% and economists expect fiscal spending to pick up by +1% into 2017. Despite investment is expected to stay modest, it may not be such a drag into 2017.
Indeed, “GDP momentum” may actually pick up. Momentum of GDP measures the standard deviation of rate of change in GDP growth. Figure 2 shows how momentum of U.S. GDP reached near “stall speed” by Q2. Recently, as Q3 saw a pickup in activity across sectors, momentum seen an uptick. This growth speed looks much like late 2012 when an uptick appeared. Although the compositional change matters much to economists, financial markets will look closely Thursday at the change in momentum of GDP.
Figure 1: U.S. GDP
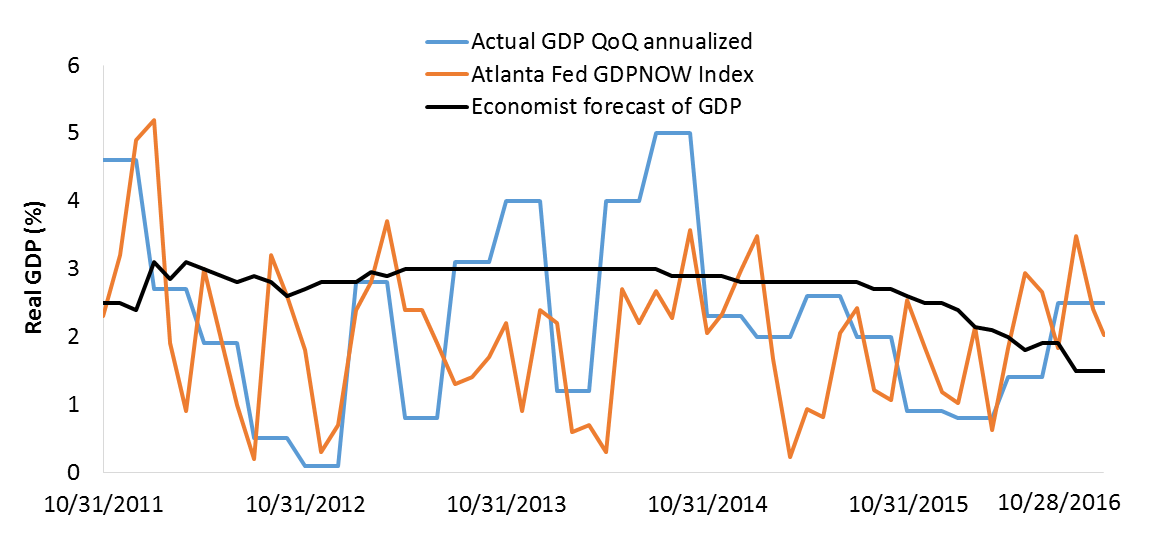
Source: Bloomberg, Federal Reserve, quarterly data 2011-2016
Such change in GDP momentum is important for asset returns. The year 2016 has seen strong returns across almost every asset class. The return distribution of returns has similarity to the year 2012. Then too, there as much uncertainty politically (Euro crisis then, Brexit now), economically (sequester then, oil now) and financially (European banks then and now). The U.S. economy was unusually slow even that the labor market had picked up in momentum. With the U.S. Presidential election in a few weeks, uncertainty that has been favorable to assets could shift to economic certainty.
Markets will respond swiftly as a new U.S. economic reality may see policy mix shifts, especially in terms of fiscal policy. Although the global economy remains soft and momentum is near “stall speed”, U.S. GDP may set to roar back, at least in the third and fourth quarter. That means nominal bond yields will likely continue to march higher with inflation expectations normalizing. Ultimately, GDP is the source of all cash flows and returns across the capital structure of financial assets. A small change in GDP momentum will have a meaningful impact on returns.
Figure 2: GDP Momentum
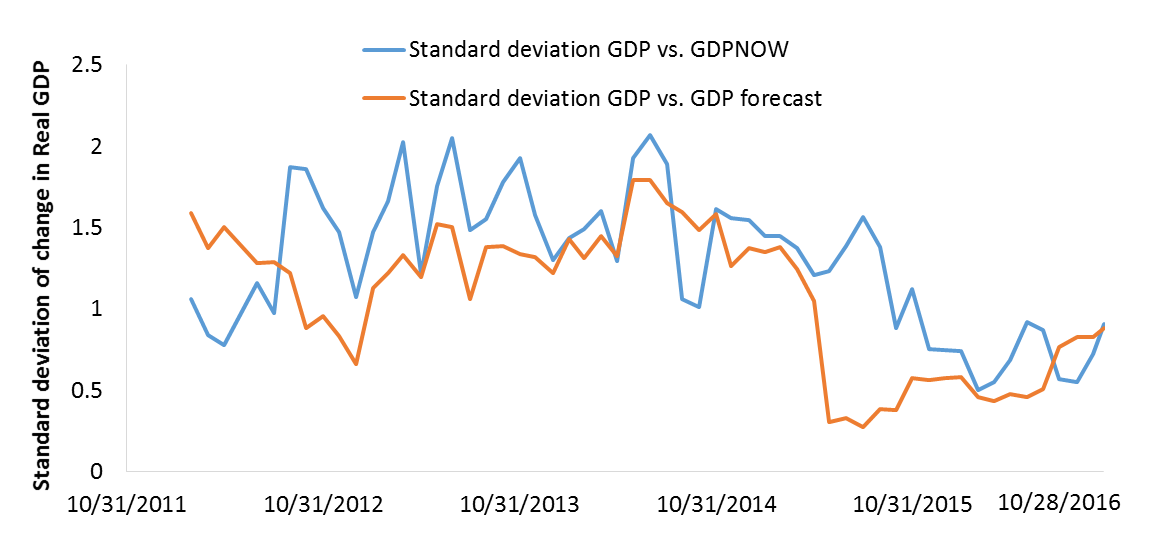
Source: Bloomberg, Federal Reserve, quarterly data 2011-2016
Comments