When quantitative easing (“QE”) ended 2014, the Fed adopted “data dependent.” When market volatility rose, the Fed used “data dependent” in communications. By lowering the probability of a hike, volatility and fears moderated (see Figure 1). The result of data dependent was the Fed needs a full year worth of data to justify one hike. Now data dependency has been two years in effect, how can investors anticipate a new policy by the Fed?
Figure 1: Historical Probability of a Hike by December and VIX Index
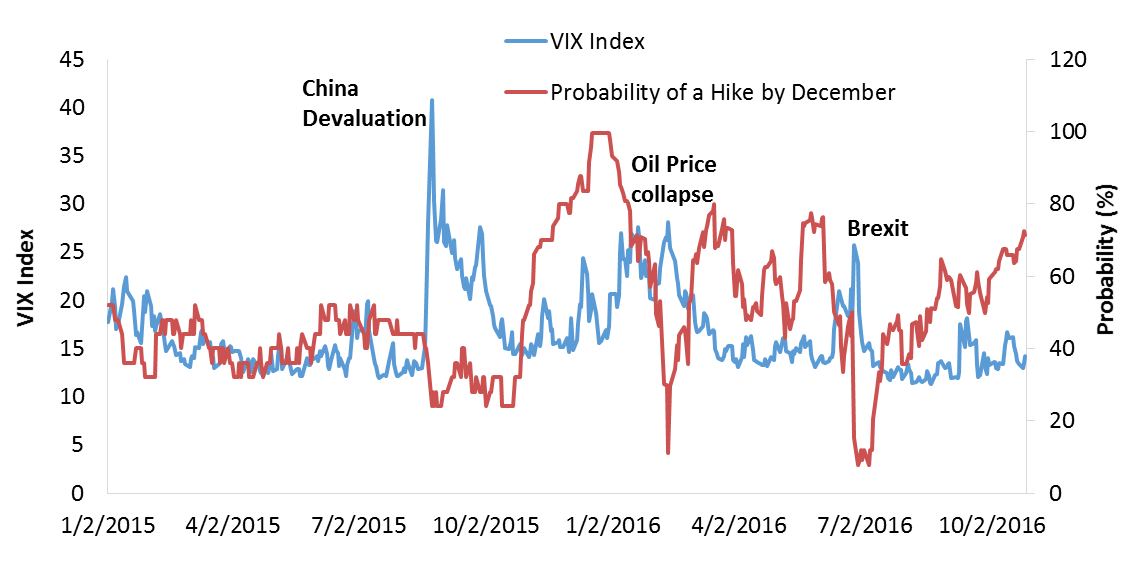
Source: Bloomberg. December probability implied from Fed Funds Futures. Probability = 100*(Dec Futures-Sep Futures)/0.125).
The answer may be found in the return of a portfolio consisting out of S&P, Barclays Aggregate, Commodity and Currency indices. Figure 2 shows that during QE and data dependency, the average return of the portfolio was 2.5 percent and volatility 0.3 percent. That history may suggest QE and data dependency had the same impact on asset returns and volatility. A possible shift from “data dependent” to a new policy could change the volatility of returns.
Figure 2: Historical Returns and Volatility of Returns
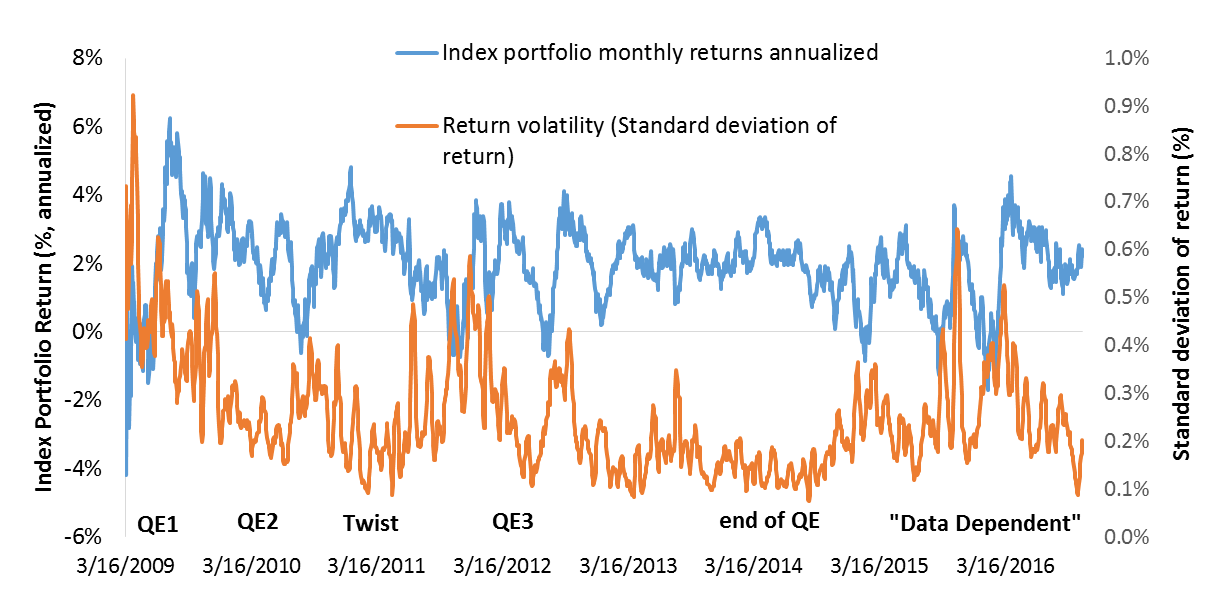
Source: Bloomberg. Index Portfolio Return = 0.25 * monthly annualized return S&P index + 0.25 * monthly annualized return Commodity Index (CRY) + 0.25 * monthly annualized return Dollar Index (DXY) + 0.25 * monthly annualized return Barclays Global Aggregate Index. Return volatility = monthly rolling standard deviation of index portfolio return, annualized.
And indeed, Fed Chair Yellen recently announced a new policy. She suggested to temporarily run a “high pressured economy.” In such an economy data dependency is replaced by a policy that allows for deviations from inflation and unemployment targets for longer periods of time. In other words, the Fed should adopt a new “Evans rule” that defines when to hike when overshoot/undershoot reach a certain threshold.
Historically, core PCE inflation has deviated from the Fed’s target by 0.2 percent for an average one year. The unemployment rate on the other hand deviated by 0.7 percent from NAIRU on average by 3.5 years. The U.S. economy has been in a “high pressure” mode before, during 1995-2001 and between 2004 and 2008 (see Table 1).
Table 1 Evidence of a “high pressure economy”: Overshoot of Core PCE Inflation and Undershoot of the Unemployment Rate
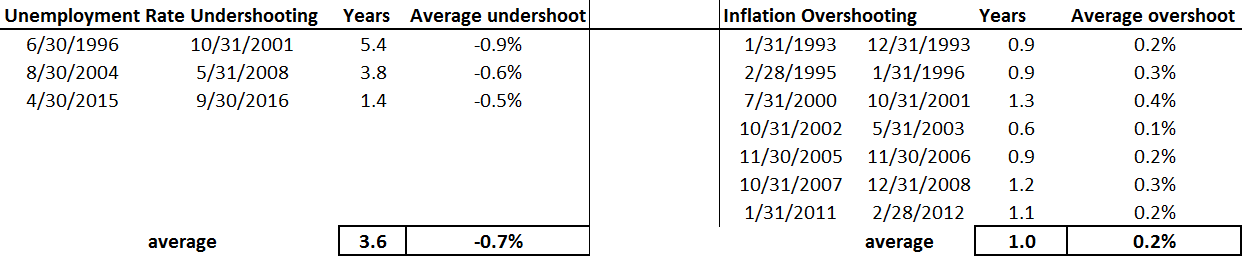
Source: Bloomberg, monthly data 1993-2016. Unemployment rate undershooting = Unemployment Rate – NAIRU.
Inflation Overshooting = Core PCE yoy% - Fed Target
For investors 1996 to 2001 and 2004 to 2008 saw average monthly returns for major indices around 0.5 percent with a volatility of 2.5 percent (see Table 2). In 2016, as unemployment improved and inflation has shown sign of gradual normalization towards target, average monthly returns for major indices were also 0.5 percent with a volatility of slightly higher than 2.5 percent (Table 2). The return and volatility profile of 2016 suggests the economy may have entered a period of “higher pressure.”
Table 2 Returns and Volatility during “high pressure economy” compared to 2016
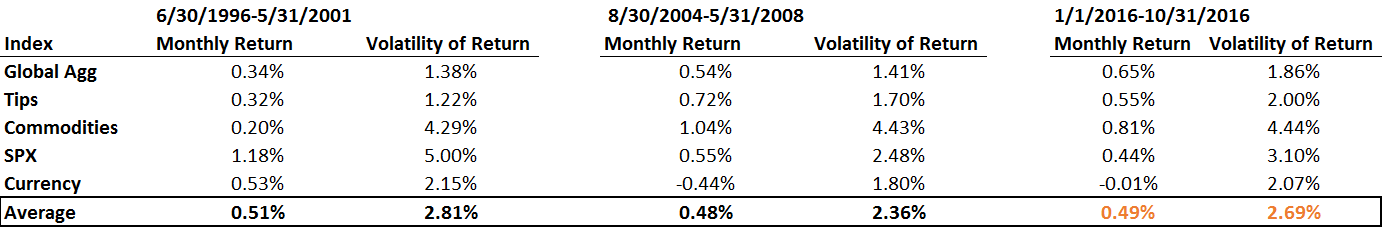
Source: Bloomberg. Average monthly return and standard deviation of return during specified periods of high pressure economy. Monthly return is (Index Value Month 2 / Index Value Month 1) -1
Investment Implications
A high pressure economy may not necessarily mean more rapid tightening. Rather, such a period may even see interim easing. For example during 1996 and 2001 and 2004 to 2008, the Fed Funds rate was hiked and eased such that the level of the Funds rate ended up lower. The U.S. economy is near full employment, and inflation overshooting is left to reach “high pressure” status. This means data dependent communication is likely to shift to the background and more frequent rate hikes may matter when inflation is above target. For investor it is relevant to look at index returns during a period of inflation running above target.
Table 3 shows Global Bonds and TIPS have the most consistent returns, while equities and commodities see the largest drawdown. The periods of high pressure (1996 to 2001, 2004 to 2008), also saw best returns for TIPs and Global Bonds. The Federal Reserve hikes in a higher inflation environment matters to preservation of returns. Given the nature of the high pressure economy policy, a larger deviation from inflation and unemployment targets advocates a greater global diversified and inflation linked allocation.
Table 3: Index Returns during Inflation Overshooting
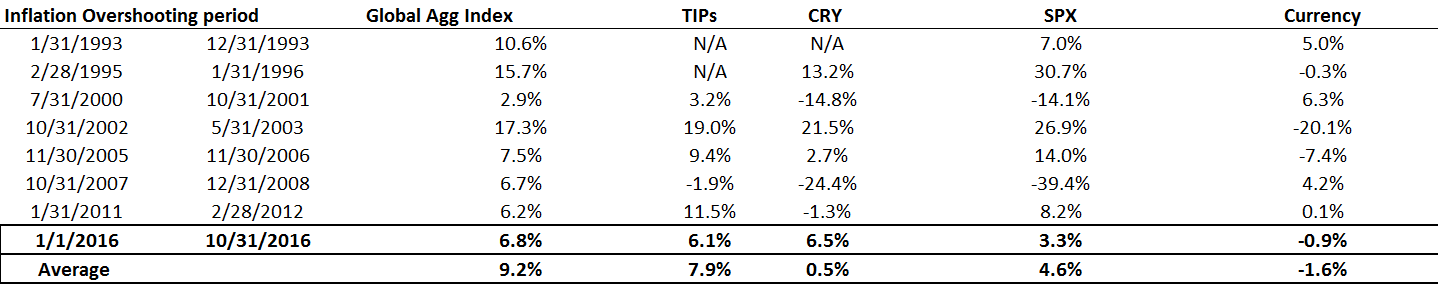
Source: Bloomberg. Index portfolio monthly returns annualized.
Comments