Elections and financial markets always had a relationship. Best known is the “Presidential Election Cycle of Investing.” This cycle shows stocks gain the most in the third year of a Presidential term, by an average of 0.75 to 2.5 per cent. For bonds, monthly returns in the third year were mostly negative by an average 2 percent based Barclays Index history. The history of returns is shown in Figure 1.
A reason for this pattern in returns is when an incumbent President announces tax cuts and or spending increases, historically those policies get Congressional approval by the second year of the term. By the third to final year of the term, policies kick into effect and impact earnings and profits. In case of a favorable response, stock prices rise and so do interest rates. This “election cycle” has lasted since 1932 but during the latest Presidential term (2012-present), the pattern broke down. There are a few reasons why that is the case.
Figure 1: Monthly Total Return for Stocks and Bonds during Presidential Cycles
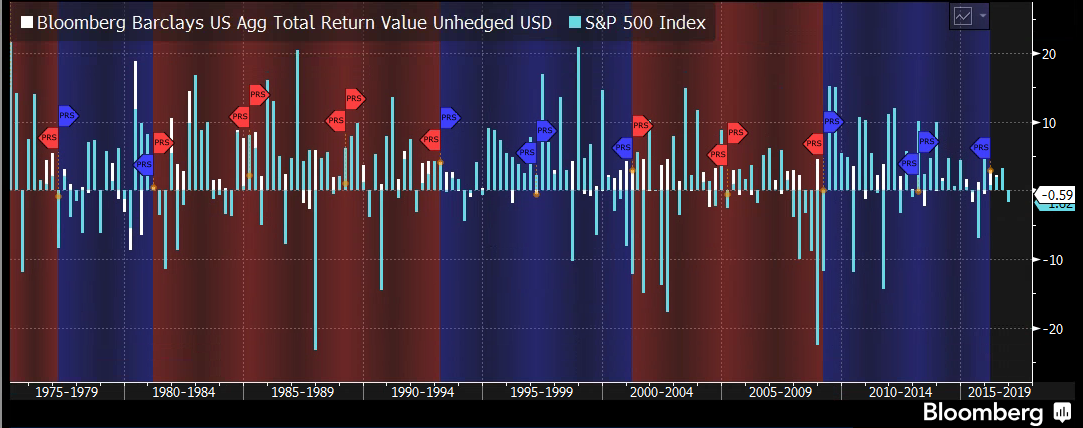
Source: Bloomberg, monthly data, 1976-2016
In a recent speech, St. Louis Fed President Bullard demonstrated average short term real interest rates between 2012 and 2016 are 200 basis points below the pre-crisis average of 2001 to 2007. This was caused by material demand for safe assets that drove down the real rate of “safe” return. Other factors are the fall in real return on capital for several decades, exceptionally low-productivity-growth, and a “high-liquidity-premium regime”, in which investors are willing to pay premium prices for government bonds. Compounded by central bank forward guidance and asset purchases, the “risk-free” rate curve flattens and risk premia were compressed. An unusually low real rate of risk free of return made uncertainty a tactical investment opportunity into riskier assets like equities. Post the U.S. debt ceiling and European debt crisis in 2012, bond and equity returns have therefore been positive.
But perhaps a more important reason is how inflation and returns have behaved during Presidential terms since 1916. Figure 2 shows in periods of higher inflation, equity returns turn negative and vice versa. Since 1916, inflation has averaged 3.3 percent, whereas inflation today is running at half that pace, namely 1.5 percent. This low rate of inflation has been very positive for both stock and bond returns because low inflation kept rates low and economic growth low but stable. Thus for equity (and) bond returns to change through the election cycle, inflation would have to change. Or in a more bearish case, inflation may need to overshoot the Fed’s target.
There are three ways how inflation may overshoot caused by political factors:
-
A depreciation of the currency due to domestic political uncertainty
-
A commodity price shock due to geopolitical uncertainty
-
Fiscal policy related inflation such as VAT, utility hikes, price controls, minimum wage hikes
Since 1916, some of these have occurred in negative (1971-1978) or positive sense (1994-1998). Any renegotiation of trade agreements may weaken the dollar and push up import prices. A new agreement by OPEC on production cuts could push up energy prices. And to balance fiscal spending, taxes on incomes may increase costs for consumers in concert with already rising health care costs. All these factors may provide scope for U.S. inflation to overshoot the Fed’s 2 percent target in 2017. In relation to the election cycle, a rate of inflation persistently higher than 2 percent target has proven negative for bonds and specifically stocks returns, as shown by Figure 2.
Figure 2: 4-year Presidential average of Inflation and S&P 500 Return
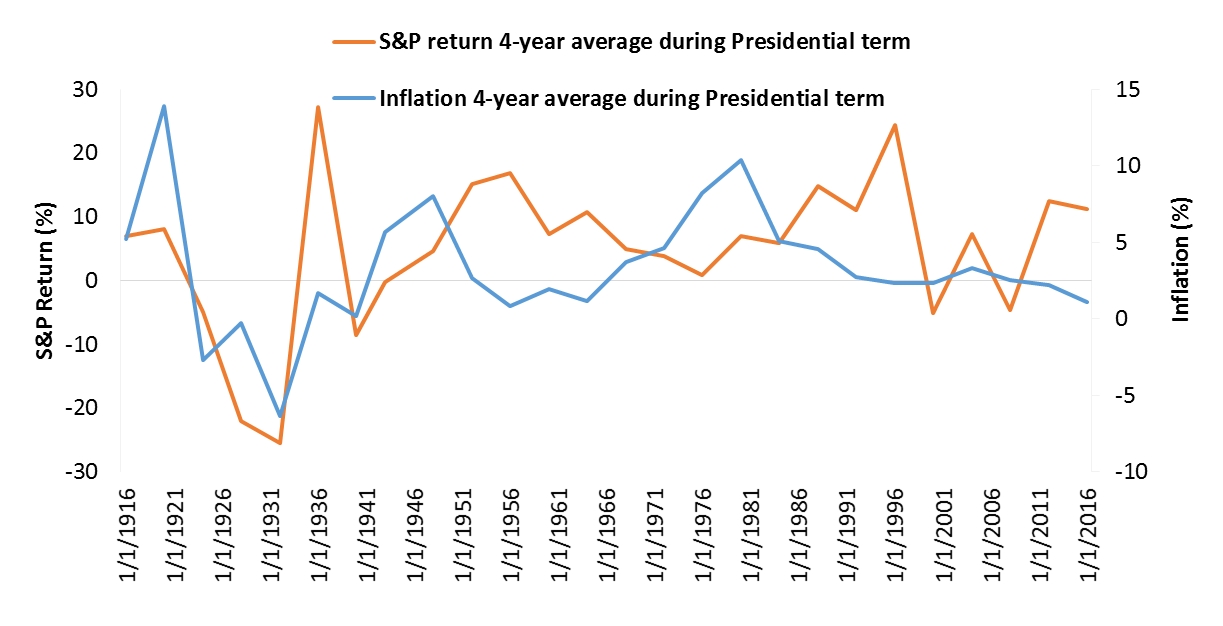
Source: Bloomberg, Federal Reserve, quarterly data, 1916-2016
With still much uncertainty surrounding the outcome of the Presidential election, one historical economic certainty is shown in Table 1, and that is the 10-year Treasury yields has averaged around 4.25% during either a Republican or Democratic Presidential term. Although this yield level seems unimaginable today (last time the 10-year Treasury traded at 4.25% was on October 7, 2008), a “normalization” of interest rates may continue to be driven by the unfolding political process. This is because political shifts in Congress and Senate in 2017 may impact indirect taxes to fund spending and alter trade policy. Combined with commodity markets coming into balance and China emerging from deflation, rising price developments may pressure monetary policy to become more preemptive with hikes than during 2015-2016.
As policy makers have realized too low interest rates are harmful, the depressed real rate of risk free return may shift higher towards the 2001-2007 average of +0.75 percent (vs. -1 percent today). Indeed, this political shift affecting interest rates will change the election cycle of returns. Dubbed as the "Presidential Pull to Par", all bonds and stocks eventually mature at par. Post U.S. Presidential Elections, at least bond returns may not fare as well as historically been the case.
Table 1: 4-year average Inflation, Growth, Employment, S&P Returns and 10-year Treasury Yield during Republican and Democratic Presidency from 1916-2016
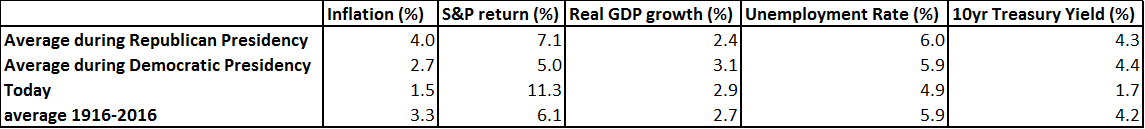
Source: Bloomberg,http://www.presidency.ucsb.edu
Comments