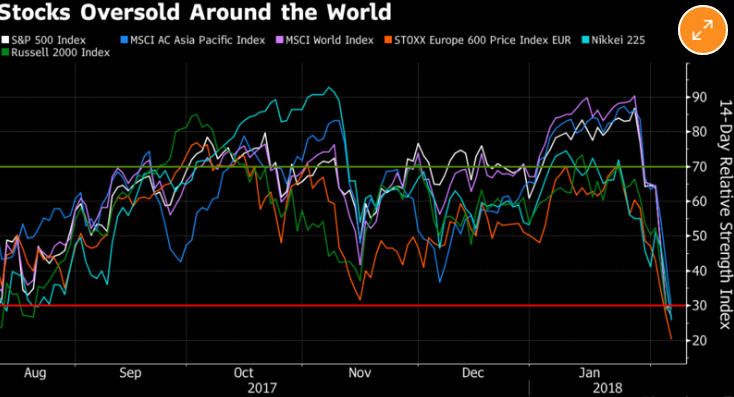
Past week’s sell off in equity markets was one of the largest in recent years. When something like that happens, market analysts like to look at indicators such as the “Relative Strength Index.” This index is a technical indicator used in the analysis of financial markets. It is intended to chart the current and historical strength or weakness of a stock or market based on the closing prices of a recent trading period. The relative strength or weakness is known as “overbought” or “oversold” conditions.
The RSI index for the S&P 500 and global equity markets reached historic overbought conditions in December before sharply reversing to oversold in a matter of days last week (see Fig.1). The change in the RSI index has pushed stocks in “correction territory.”
Figure 1: RSI Index (Source, Bloomberg L.P)
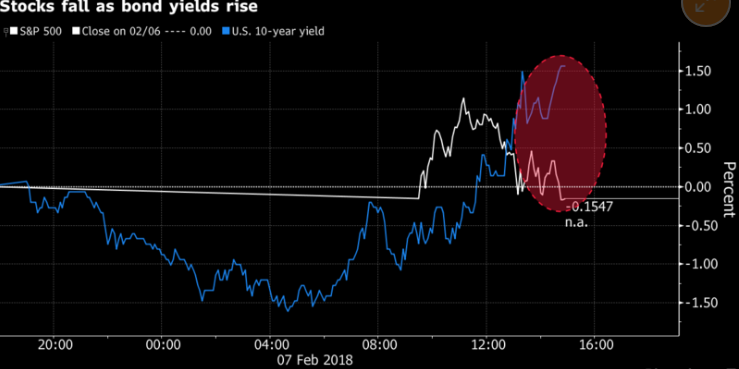
So, what about bonds? Yields climbed to the highest since 2014 and are closing in the 3% handle on the 10-year that strategists see as a pivotal level. And while yields are rising, stocks dropped sharply, a combination not often seen (see Fig. 2). This doesn’t necessarily speak to positive economic growth that tends to see rising yields and rising stock prices. There is certainly a regime shift happening among investors after a year of exceptional calm.
Figure 2 (Source Bloomberg,L.P)
While trying to find an explanation of what happened is relevant, what matters more for investors is the “relative value” between bonds and stocks, now both have lost value in the past week. A simple way is to say that stocks and bonds both have value because you can buy equities at a lower price while invest in bonds at a higher yield.
To assess this is the case, the “hedge ratio” may provide an answer. In finance, the hedge ratio is calculated as the correlation between stocks and bonds, and multiply by the volatility of stocks relative to bonds. If you do this for Treasury bonds and the S&P 500, you can calculate the historical hedge ratio (see Fig. 3).
A negative ratio indicates that bond yields may have value relative to stocks. A reason is the volatility of stocks is much higher than bonds. That has been historically the case and even more so past week when the Volatility Index (VIX) reached highs not seen since the 2008 crisis while volatility of bonds only marginally rose higher. A negative hedge ratio says it could be a good time to hedge a stock portfolio with bonds.
This is particularly true should stocks decline further because the effect of stock volatility can impact economic data negatively in the future. That may be supportive for bonds. Investors and markets will ultimately rationalize what asset class has most value based on fundamental analysis. If the economy were to deteriorate from here, investors may turn more conservative.
Figure 3: Hedge Ratio Bonds vs. Stocks
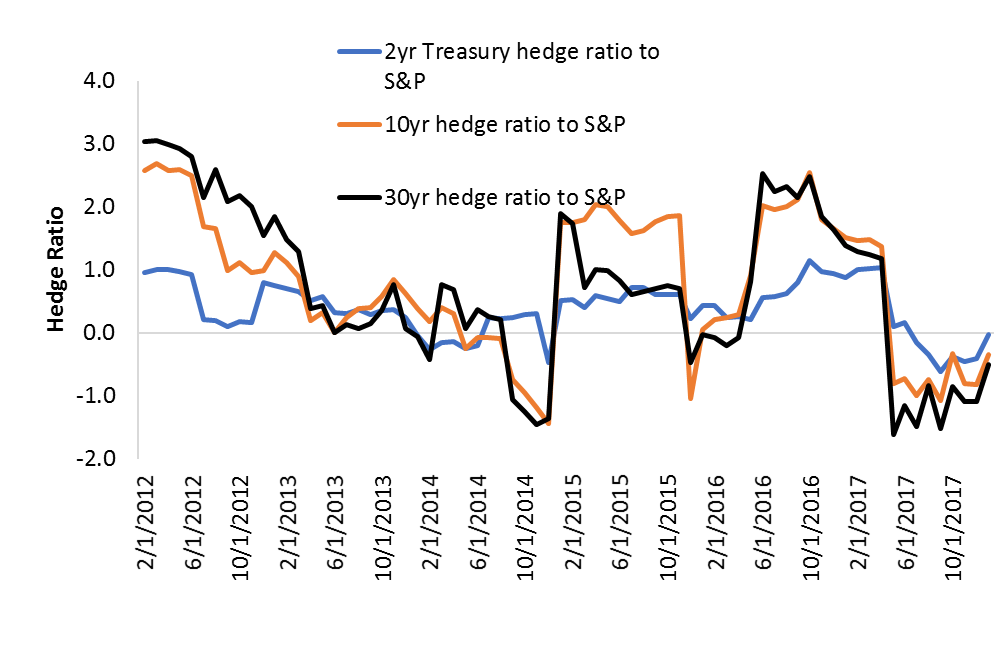
Source: Bloomberg. Hedge ratio = correlation (asset A, asset B) * (volatility asset A)/volatility (asset B)
Comments