Yields are falling despite the Fed, the Bank of Canada and the Bank of England, want to hike interest rates. The long end of the yield curve responds with natural defense because soft inflation and hikes means the Fed will not meet the inflation target. Indeed, the Treasury Inflation Protected Securities (TIPS) curve discounts a below target inflation for the next 30-years. This expectation has been in place since late 2014 since QE3 ended. Since that time, the 10-year has been in a downtrend with occasional sell offs (like during Trump election). The chart below shows the 10-year since the end of QE3 (October '14) until today, compared to the 10-year during 2001-2006 period.
Figure 1
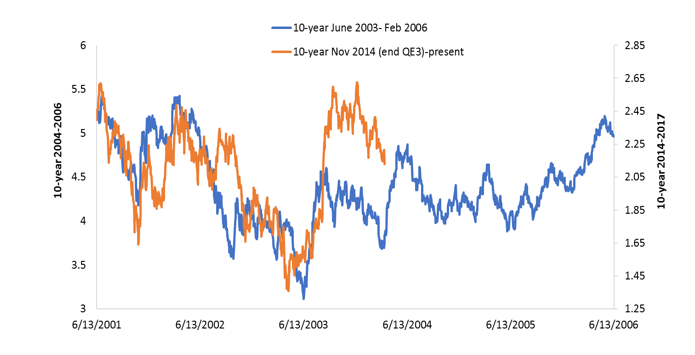
Source: Bloomberg
It is interesting to note the 10-year is following almost identically the 2001 to 2006 period, when after the initial 2003 deflation scare, the 10-year subsequently normalized. There are some parallels to be drawn as well. The flattening of the yield curve today is running at almost the same monthly pace as back in 2004 to 2006 (7 to 10 basis points or 0.007 percent). The Fed is moving in an almost similar 'measured' pace of interest rate hikes, and inflation was muted and trending mostly below 2 percent.
A different force is the Federal Reserve’s balance sheet that back then was small. At a $ 4.5 trillion in size, the Fed announced a plan to gradually unwind the balance sheet by setting “caps” on the monthly amounts of principal and interest that is reinvested. The gradual change to the reinvestment policy will continue to build pressure on long-term rates because the Fed will keep over 75% of current reinvestment in place until mid to late 2018. By that time, the reinvestment phases out which then may cause a directional change in long term interest rates.
Figure 2
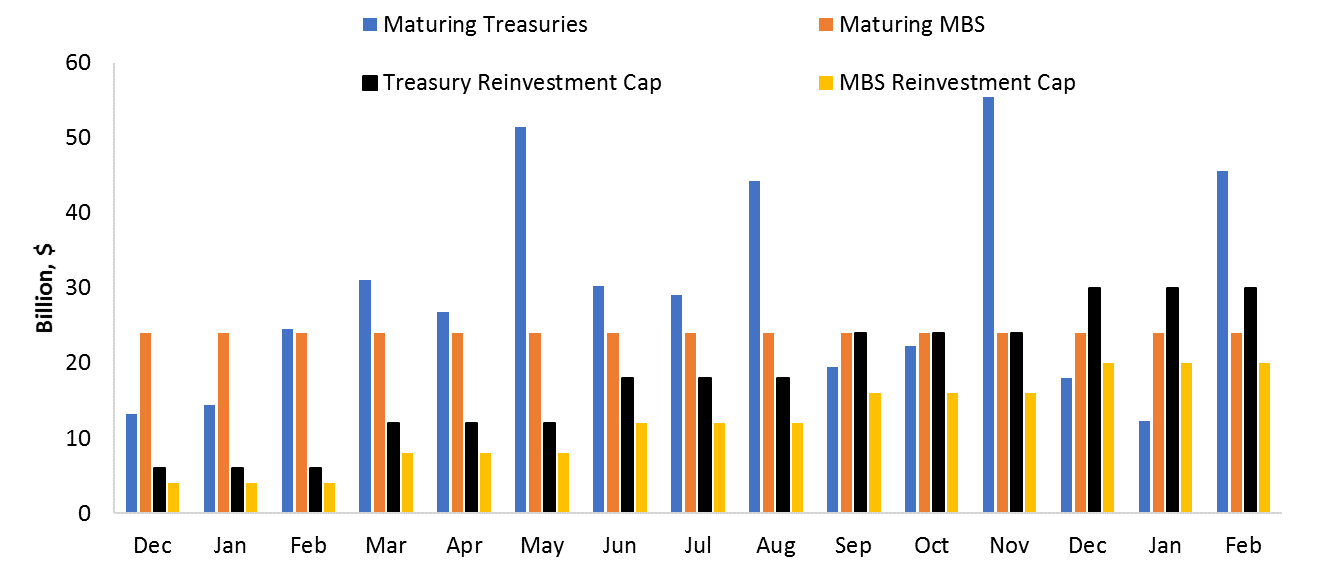
source: Bloomberg
With a general uncertainty overhanging the U.S. economy, the 10-year may follow the period of 2004 to 2006, which became a protracted range of 4 to 4.6 percent with occasional bouts of selloffs. Based on today's levels, the downside in the 10-year yield is 1.65 percent to 1.85 percent with the upside of near 2.3 percent. This range may change when inflation sees a resurgence as the labor market continues to tighten. That is the mantra the Fed is currently basing policy on and it is therefore likely if financial conditions remain loose, the Fed will execute its plan to bring the Funds rate to 2 percent by 2018.
For the 10-year to break out of the range, the labor market would have to materially tighten. To see why that could be the case, Figure 3 shows the U.S. unemployment rate lagged by a decade to the unemployment rate of Japan. Based on demographic adjustments, the U.S. unemployment rate could fall by another percentage point over the course of the next few years. The Fed somewhat acknowledged this is possible by lowering its forecast of the long run unemployment rate to 4.2. The likelihood of a lower unemployment rate and moderate inflation is likely to stay in place for the time being, which means the 10-year may indeed resemble a similar range a decade ago.
Figure 3
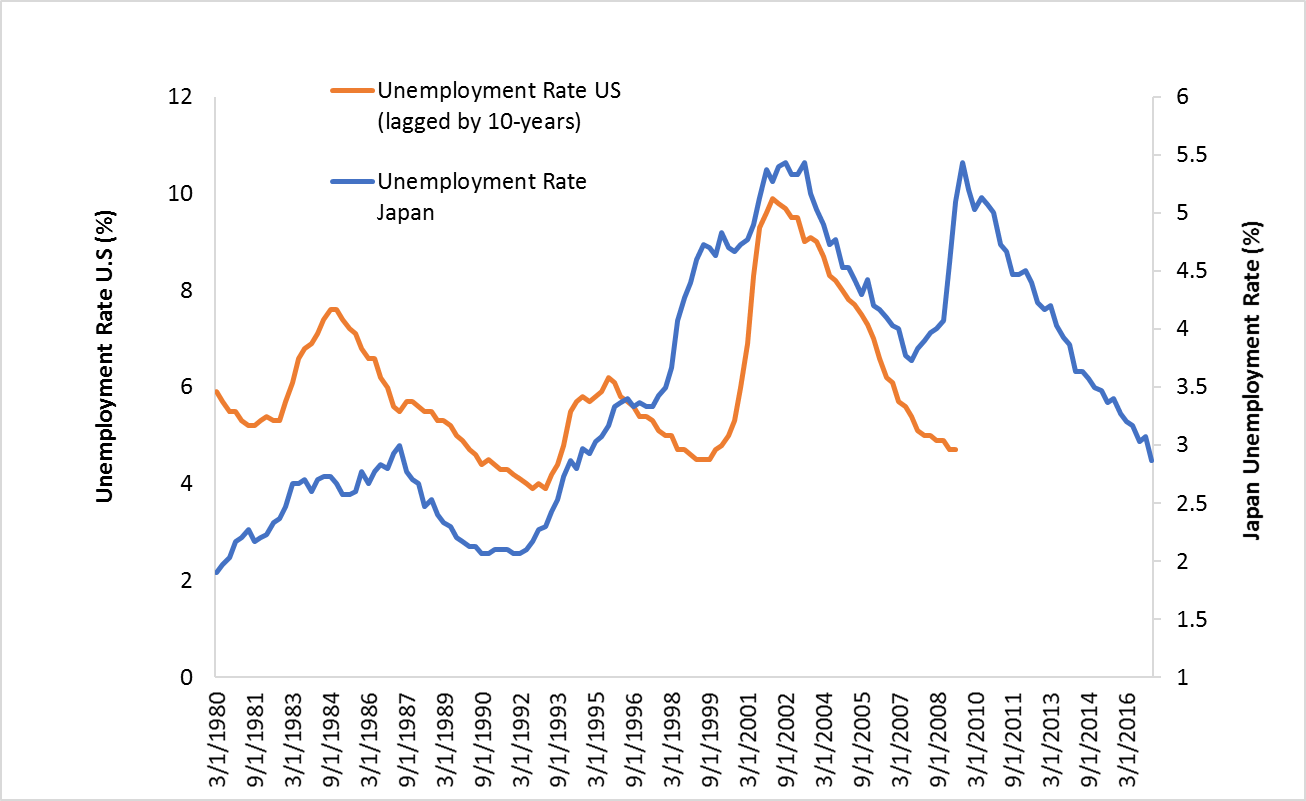
source: Bloomberg
Comments