How today’s economic boom mirrors the structural change the US saw in the - Railroads through Electricity - buildout of the Industrial Revolution.

(Reshared from my personal Substack): https://davidjlaplaca.substack.com/p/every-era-rewires-its-world-today?r=39w8z
To truly grasp today’s economic surge, we must step back from superficial comparisons of the 2000 dot-com bubble.
The more apt historical parallel lies in the 19th-century industrial buildout - from railroads (as a foundational distribution network) to electricity (the early dawn of widespread compute power).
Our current era has dynamics that echo that period. Think of our “New Era” as the period beginning from 1994 through today.
Similarly, the internet emerged as a disruptive distribution backbone and has now facilitated the unleashing of Artificial Intelligence as the transformative compute force that is reshaping everything
Introduction:
Analogies in Scale and Disruption
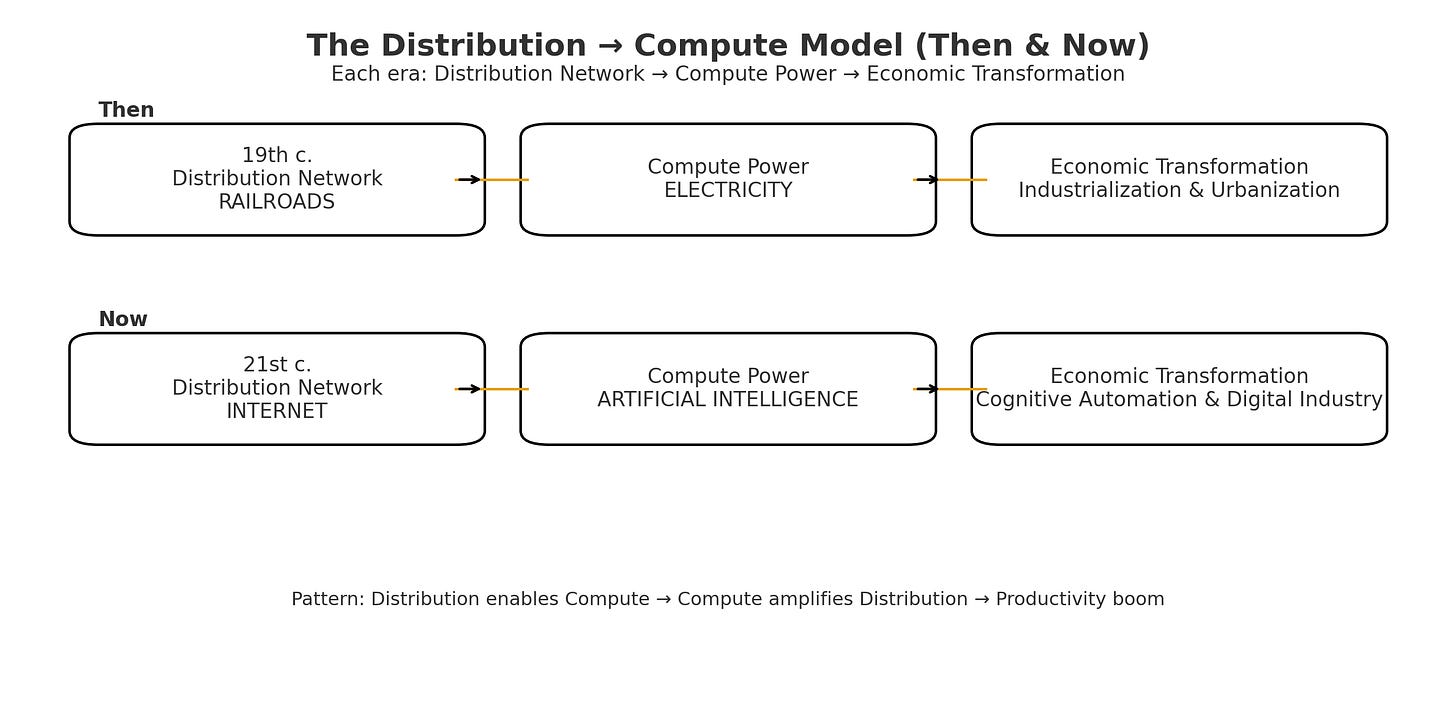
This paper advances a structural thesis: technological revolutions proceed as a two-layer system in which a distribution network enables a compute platform, and the platform in turn raises the returns to the network. Historically, the buildout of the railroads catalyzed the advent of electrification. This was through early adoption, urban projects, and materials transport, while electricity magnified rail productivity via signaling, traction, lighting, and round-the-clock operations. We develop the modern parallel to the “New Era”: The internet as a global data distribution network enhanced by cloud utility models and semiconductor capacity have made AI a general-purpose “compute layer”. Additionally, this advanced technology compressed diffusion throughout the economy from ~50–70 years to ~15–20. Notably, this occurred while generating deflationary impacts and efficiency gains. We compare adoption timelines, quantify capital intensity as a share of GDP, and examine patterns of market dominance across eras. Finally, we assess risks, including concentration and labor disruption and derive investment implications: enduring value accrues to companies that are truly AI-native. These are those that commit with conviction to AI across product and operations, whether they operate the grid (data centers, cloud platforms, semiconductor ecosystems), provide core compute, or build the next generation of downstream applications.
Executive Summary:
The current economic boom, powered by artificial intelligence, mirrors the railroads-to-electricity transition of the Industrial Revolution, provided energy and politics (tariffs) and permitting keep pace. In both eras, massive investment into distribution infrastructure ~ rails then, the internet now, laid the foundation for the next general-purpose technology platform to emerge. Just as railroads connected physical economies and enabled the diffusion of electricity as a universal power source, the internet has connected digital economies and enabled AI to function as a universal compute layer.
This white paper demonstrates that the relationship between distribution and compute is not metaphorical but structural. Each industrial epoch follows the same sequence: a network buildout phase that connects and distributes, followed by a compute phase that transforms and scales productivity. Railroads required over $12 billion of capital (≈$350 billion today) to knit together an industrial economy, paving the way for electricity’s diffusion and a century of compounding growth. Likewise, in the “New Era” Goldman Sachs (Briggs et al.) estimates $5–19T of present-discounted value from U.S. AI-driven productivity gains, with a central case near $8T
AI’s expansion in compute power and productivity.
Key findings show that adoption cycles are accelerating, from roughly 60 years for railroads and electricity to less than 20 for the internet and AI. The causal chain is clear: global connectivity created unprecedented data availability; cloud platforms turned compute into a utility; and semiconductor advances made intelligence scalable. Together, these forces have compressed innovation cycles and generated deflationary efficiency gains across industries, echoing the economic effects of electrification a century ago.
Just as General Electric and Westinghouse emerged as the utilities of the electrical age, hyperscalers and chipmakers such as Amazon, Microsoft, Google, Nvidia, and TSMC, now anchor the AI economy as the “digital power grid.” The implications for investors are profound: value will accrue to the enablers of compute (including energy providers) and infrastructure, not merely to downstream applications. Yet, as with every technological revolution, this cycle brings new risks including High valuations in markets, market concentration, displacement, and regulatory asymmetry that must be navigated with strategic discipline.
By understanding AI as the electricity of our era and the internet as its distribution network, investors can recognize the current boom for what it is: less likely a speculative echo of 2000, but the next structural phase of industrial and economic transformation.
The railroads of the 19th century functioned as a revolutionary distribution network, connecting vast geographies and enabling the efficient movement of goods, people, and resources. This infrastructure required enormous capital expenditures but laid the groundwork for electricity, which transformed railroads into more efficient systems through powered signals, lighting, and operations. Without railroads, electricity might have remained a novelty; instead, the combination remade economies by enabling 24/7 productivity and urban expansion.
The Symbiotic Relationship Between Railroads and Electricity
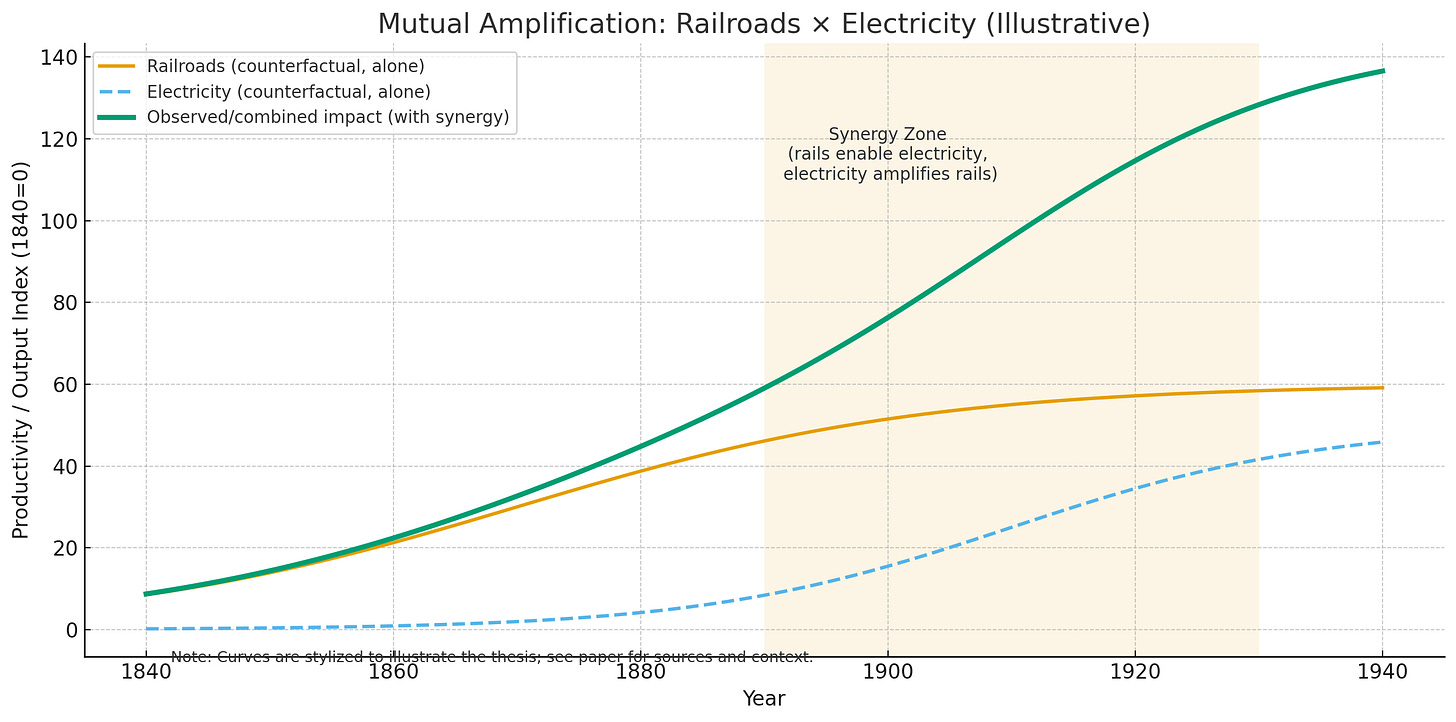
The railroads of the 19th century, as the era’s first massive distribution network, required enormous capital expenditures—totaling approximately $12 billion nominally by 1900. Using relative share of GDP as the adjustment method (which accounts for growth in overall output), $12 billion in 1900 would be equivalent to about $3.2 trillion today—reflecting how much larger the modern U.S. economy is (MeasuringWorth, 2024) — to lay tracks across thousands of miles, connecting remote resources to urban centers and shrinking economic distances. This infrastructure not only facilitated the efficient movement of goods but also laid the groundwork for electricity’s widespread adoption, creating a symbiotic relationship where railroads accelerated electricity’s development, while electricity’s economic impact was amplified exponentially because of the existing rail network. Below, we explore this bidirectional dynamic with historical examples, supported by research, to illustrate how the combination remade economies through enhanced productivity, urban expansion, and 24/7 operations.
How Railroads Accelerated the Adoption of Electricity
Railroads acted as early adopters and catalysts for electricity by demonstrating its practical viability on a large scale, investing in supporting infrastructure, and transporting essential materials, which collectively spurred broader societal electrification. For example, In 1880, Thomas Edison tested the first generator-powered locomotive on a track at his Menlo Park laboratory, laying the foundation for practical applications. By 1887–1888, Frank J. Sprague’s electrification of the Richmond Union Passenger Railway in Virginia created a 12-mile trolley system with 40 cars, becoming the standard for urban transport. This success led to over 900 electric streetcars on 12,000 miles of track in U.S. cities within a decade, accelerating municipal adoption of electricity for public transit and phasing out horse-drawn systems (HistoryNet, 2023; Wikipedia, 2024). The 1895 electrification of the Baltimore & Ohio Railroad’s 7.2-mile Belt Line tunnel in Baltimore, using General Electric locomotives, eliminated steam-related pollution and became a model for urban rail. Similarly, the 1902 Park Avenue tunnel accident in New York, which killed 17 due to steam-obscured signals, prompted a 1903 state law banning steam locomotives in Manhattan by 1908. This drove massive projects like the New York Central’s electrification of Grand Central Terminal (completed 1913), which required building two dedicated power plants and enabled multi-level expansions. These initiatives not only proved electricity’s reliability but also influenced the “War of the Currents” resolution in 1896, where patent pooling 5 between GE (DC) and Westinghouse (AC) advanced long-distance transmission technologies (HistoryNet, 2023; Trains Magazine, 2009). Railroads invested in dedicated power stations and distribution systems, which often extended to nearby towns and industries. By the 1910s, railroads began relying on public utilities, reducing costs and promoting grid expansion. Moreover, railroads transported coal, copper wires, and generators essential for building electrical infrastructure; without this distribution network, the cost and logistics of scaling electricity would have been prohibitive.
Without railroads’ early demand and investments, electricity might have remained a localized novelty, confined to laboratories or small urban demonstrations, as seen in pre-rail eras where power sources like water wheels limited scalability.
Why Electricity’s Economic Impact Was Far Greater Because of the Railroads
Conversely, electricity’s transformative power was magnified by the pre-existing railroad infrastructure, which provided a vast, ready-made platform for application, enabling railroads to evolve into more efficient, round-the-clock systems that supercharged industrial output and urban growth. Economic historian Paul David argues in his seminal work on technological diffusion that electricity’s productivity gains were “path-dependent” on prior networks like railroads, which amplified its effects by integrating it into high-volume operations (David, 1990). Without rails, electricity’s impact might have been limited to isolated factories; instead, it leveraged the rail grid to create interconnected, electrified ecosystems.
Electricity transformed railroads through powered signals, lighting, and traction, allowing safer, faster, and non-stop service. For instance, the 1895 electrification of the Pennsylvania Railroad’s Burlington to Mount Holly line enabled smoother acceleration and precise scheduling, increasing passenger traffic by over 350% on the Long Island Rail Road’s electrified segments by 1920. Electric locomotives, with fewer moving parts, reduced maintenance costs by 20–30% and provided 50% greater tractive force, as seen in the Norfolk & Western’s 1925 electrification, which pulled 50% more tonnage at 12.5% lower costs (HistoryNet, 2023; Wikipedia, 2024). The Chicago, Milwaukee & St. Paul Railroad’s 1927 electrification of 900 miles doubled freight tonnage and improved mountain schedules, while the Pennsylvania Railroad’s 1939 network (2,000 miles) shortened run times, doubled freight, and quadrupled passengers during WWII (Trains Magazine, 2024).
With railroads as the backbone, electricity enabled 24/7 factories and urban expansion by powering rail-linked industries. Rail towns got electricity first for signals and depots, then extended grids to homes and mills, boosting GDP per capita by 200% from 1900–1940 through non-stop production (Gordon, 2016). 6 Inflation-adjusted data shows electricity halved factory energy costs, but this was amplified by rails’ distribution of electrified goods, stabilizing prices (goods dropped 10–15% in the 1920s) and fostering suburbs via commuter lines. A McKinsey Global Institute report on historical tech waves notes that electricity added 1–2% annual productivity growth in rail-connected regions, far higher than in isolated areas, due to synergies like regenerative braking returning energy to grids (Manyika et al., 2013).
Studies estimate that electrified railroads contributed 10–15% to U.S. GDP sectors by the 1930s, with spillovers to manufacturing (e.g., appliance booms) and logistics empires. Without rails’ scale, electricity’s diffusion would have taken decades longer; instead, it remade economies by turning distribution hubs into glowing, efficient nodes (Fishback & Kantor, 1996).
Electricity: The First Compute Layer — and What It Teaches Us About AI
Electricity was not merely a new fuel. It was the first platform that allowed a scalable and distributed compute layer. It became a general-purpose capability that standardized and shared programmable work across the economy. Its power came less from any single device than from the system wrapped around it: generation and transmission, motors and controls, and, most importantly—the organizational redesigns of those components made possible.
In the steam era, factories were organized around a central prime mover. Line shafts and belts dictated where machines sat and how work flowed. Electrification broke that constraint. Small motors at each workstation let plants be rebuilt around the process rather than the power source. The shift from line shafts to unit drives cut material handling, downtime, and accidents; it unlocked flow-line production and tighter quality control. Signaling, lighting, and early control gear extended those gains, enabling precise scheduling and safer, round-the-clock operations. In today’s language, electricity lowered latency, raised reliability, and introduced the first real orchestration of complex work.
These benefits did not arrive all at once. Early adopters often swapped steam for dynamos without rethinking plant layout and captured only incremental gains. The step-change came when firms rewired their organizations around distributed power, moving machines, redesigning workflows, and retraining labor to exploit the new capability. Geography and institutions mattered too. Urban industrial nodes electrified 7 first; rural regions followed through policy (e.g., the Rural Electrification Administration). The lesson is durable: general-purpose technologies do not transform economies at the moment of invention but when enterprises and institutions restructure around them.
The macro effects were decisive. As factories shifted to continuous processes, energy costs fell and output per worker rose. New categories such as appliances, elevators, refrigeration and more created markets that stabilized utility loads and extended the grid’s economics. Productivity accelerated through the twentieth century’s “special century,” with electrification a central driver of the 1920–1970 gains. Prices for electrified goods declined as scale, learning, and capital utilization compounded. Spillovers ran upstream into steel, copper, and machine tools and downstream into households—deepening the footprint and resilience of the system. Market structure evolved accordingly. High fixed costs, network externalities, and reliability imperatives favored vertically integrated utilities and large system integrators. These entities built and controlled the grid, often earning durable returns, in spite of significant regulatory burdens. Scale and cost curves selected the technical winners; policy determined how the surplus was shared. For investors, the message was clear: value accrued both to the builders of the system and to the operators who could integrate it into production at scale—but returns were mediated by regulation, access, and institutional capacity.
This history clarifies the present. Electricity’s payoff did not come from bolting a motor onto a steam-era factory; it came from re-architecting the factory around controllable, distributed power. AI is the analogous compute layer for cognition. Its payoff will come where organizations rebuild workflows, data collection, closed-loop decisioning, human-in-the-loop exception handling, deployment and retraining—rather than grafting a model onto legacy processes. Advantage sits in the stack (data → features → models → orchestration/agents → delivery → feedback → retraining) and in the operating model that compounds learning.
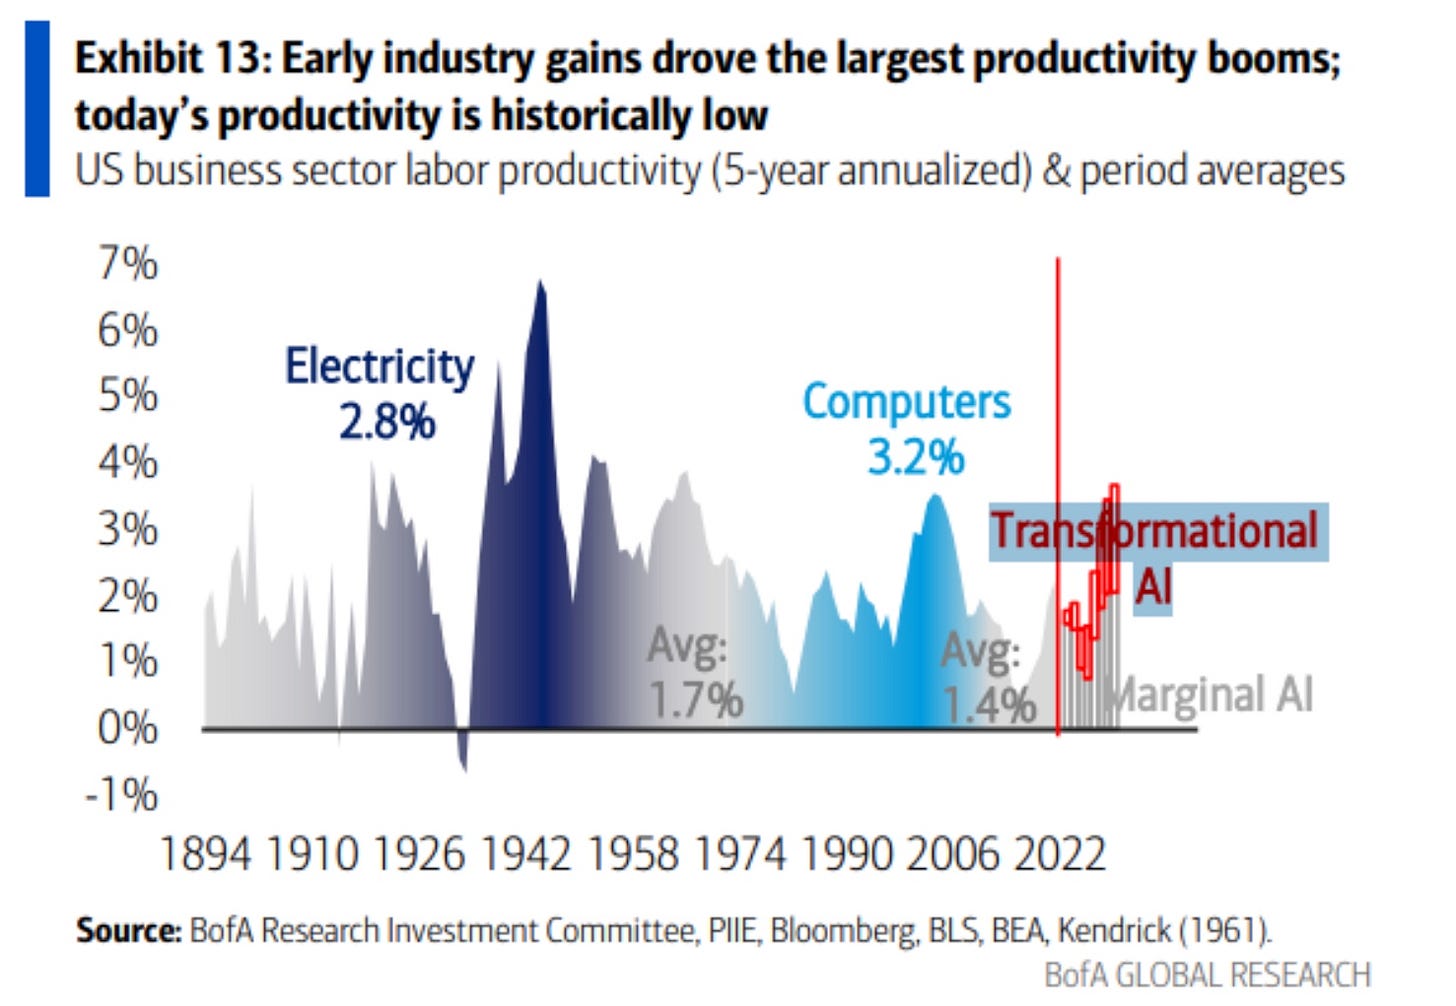
The Macro-economic effects were unmistakeable, a massive increase in Industrial productivity. It is our contention that this same type of productivity boom from our current boom has just begun- with plenty of room for upside. Once AI has grown to a sufficient scale of deployment within the economy, the efficiency gains will be striking.
The parallels and the chokepoints have significant similarities. Scale, capex, and networks mattered in electrification; with AI, the gating factors currently are power, silicon and advanced packaging, data rights, latency/connectivity, talent, and regulation. Winners underwrite these constraints better than peers and design around them—hybrid inference to reduce latency and cost, retrieval to cut context, distillation and quantization to improve unit economics, compilers and caching to squeeze more value from the same compute.
Crucially, the question is not “infrastructure or applications.” Electricity rewarded grid builders and the firms that rebuilt production around it. Likewise, durable AI value accrues to businesses that are AI-native by design—whether they operate the grid (data centers, cloud platforms, semiconductor ecosystems), provide core compute (foundation models, inference platforms, agent frameworks), or own the workflow (vertical applications that automate end-to-end jobs and capture outcome value). The common trait is the new paradigm upon which all future innovations were built. It takes 9 conviction to capitalize and win: capital, product, and organization structured around AI as the engine—not a feature.
Electricity turned energy into programmable work and paid off when we rebuilt around its logic. AI turns information into programmable decisions and will pay off where organizations rebuild to compound learning. That is the difference between AI-native and AI-adjacent—and it’s where the next decade’s returns will concentrate.
The “New Era”: Internet-to-AI Revolution: The Modern Distribution-to-Compute Transition
Just as the railroads laid the physical foundation for the spread of electricity, the internet has built the digital distribution network that enables the rise of artificial intelligence. The internet—first as a communication protocol, then as a global data infrastructure—functioned as the 20th century’s equivalent of the rail grid, connecting the world’s information, devices, and compute capacity. Artificial intelligence, now emerging atop that platform, mirrors electricity’s role as the next general-purpose technology: an ambient compute layer capable of permeating every sector of the economy.
Internet as the Foundational Distribution Network
From the 1990s onward, the internet connected the globe’s human and machine nodes much as railroads connected its physical ones. Internet penetration grew from less than 1% of the global population in 1990 to over 70% by 2025 (International Telecommunication Union, 2024). This rapid diffusion dwarfs the 60–70 years it took for railroads or electricity to reach comparable coverage. Each new layer of connectivity, from dial-up to broadband to mobile 5G compressed distance, accelerated commerce, and reduced transaction costs, analogous to railroads shrinking geographic frictions. The capital intensity of this build-out rivals that of the 19th-century rail expansion. Global telecommunications and data center investment “pre Gen AI” exceeded $500 billion annually by 2023 (Statista, 2024), forming the substrate upon which cloud computing, distributed databases, and real-time applications could scale. Like the rail network’s steel and timber, fiber optic cables and data centers became the conduits of modern economic flow—distributing bits instead of goods.
The “New Era”- How the Internet Enabled AI’s Emergence
The rise of AI is not an isolated technological leap but the natural outgrowth of the internet’s infrastructure. Three interlocking developments made this possible:
1. Data Distribution: The internet created the world’s largest and most diverse corpus of structured and unstructured data—web pages, social networks, videos, sensor feeds. This vast and continuously refreshed dataset provided the training material essential for machine learning at scale. Without a global digital distribution layer, AI would have lacked both volume and variety of data—just as electricity would have lacked purpose without the rail network’s industrial demand.
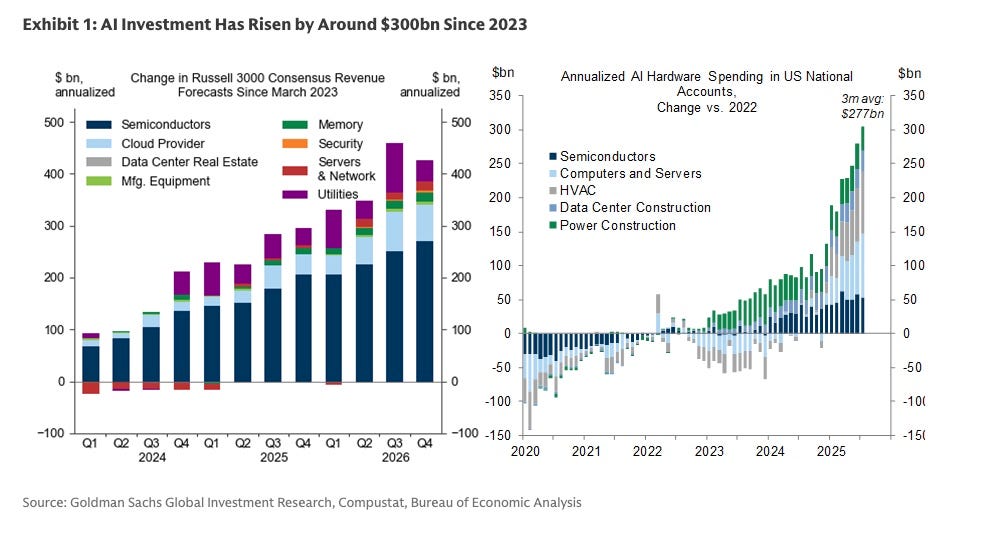
2. Cloud Infrastructure: The proliferation of cloud platforms such as AWS, Azure, and Google Cloud, transformed compute access into a utility model, mirroring electricity’s democratization of power. Synergy Research Group reported that worldwide spend on data center hardware and software (a key proxy for cloud infrastructure CapEx, including servers, storage, networking, OS, virtualization, and security) reached $282 billion in 2024, up 34% from 2023. These “digital power plants” provided elastic, on-demand compute, storage, and networking—the functional equivalent of the early electric grids that powered factories and rail lines. 11

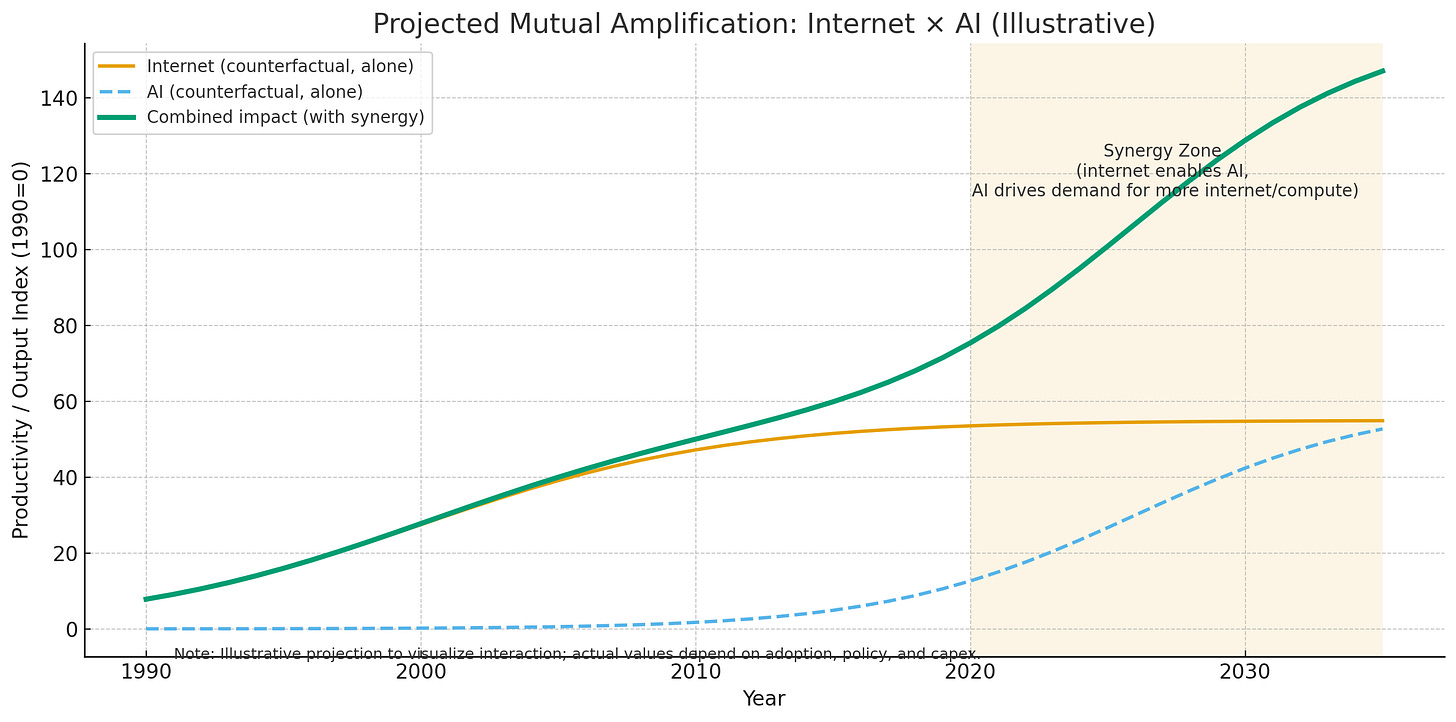
3. Semiconductor Scaling and Distribution: The rise of GPU and TPU clusters, interconnected through the global internet backbone, formed the mechanical substrate of AI compute. Nvidia’s data center revenue alone grew from under $1 billion in 2016 to over $47 billion by 2024 (Nvidia Annual Report, 2024), marking the same type of industrial-scale leap once seen in power generation. Each new node of compute—whether a hyperscale data center or edge device—adds to a globally synchronized compute grid. Together, these layers—data, cloud, and compute—created a self-reinforcing system: more data increased model sophistication; more compute reduced inference costs; better models generated more productive digital activity. This is the modern analog of the railroad-electricity feedback loop: distribution enabling power, power amplifying distribution.
Powering the Intelligence Build-Out: Why Energy Is the Macro Story
Before the current AI wave, U.S. data centers drew a few percentage points of national load—meaningfully large, but manageable within existing generation and wires. That world is gone. The step-change isn’t the number of buildings; it’s the watts per rack and the duty cycle of inference. A conventional enterprise data hall designed around 5–10 kW/rack is now competing with AI clusters that budget 30–60 kW/rack, moving toward 80–120 kW with liquid cooling. Translate that into system terms and you see the delta: sites that were 20–50 MW a decade ago are now 100–300 MW campuses, often planned in multi-campus “districts” measured in gigawatts. Put simply, an additional 1–2% of U.S. electricity demand from “the internet” has become a trajectory toward mid-single-digit percentages from AI alone within the planning horizon—concentrated in a handful of metros where the fiber, talent, and suppliers already live. This is why “available, deliverable megawatts” has become the gating asset class of the decade.
Where will those megawatts come from? In the near term, from whatever is fast, firm, and financeable. Life-extension of existing nuclear and efficient gas, uprates on hydro and nuclear, and targeted gas-fired capacity where interconnection is feasible will bridge reliability while the renewable pipeline scales. Utility-scale solar—almost entirely photovoltaic in the U.S., not concentrated solar thermal—and onshore wind will continue to supply the cheapest incremental MWh. Storage will shift that energy into the evening peaks; four- to eight-hour batteries are bankable today, with longer-duration storage arriving later in the decade. The hyperscalers—the “Mag 7” in market shorthand—are already writing the playbook: Amazon remains the largest corporate buyer of renewables globally; Google is pushing toward 24/7 carbon-free procurement and has contracted enhanced geothermal; Microsoft has signaled interest in next-gen nuclear and even fusion PPAs while expanding wind and solar; Meta and Apple continue to back utility-scale solar and wind adjacent to their campuses. None of this is charity. Without cheap, reliable power, a data center is just expensive real estate. The sites that miss on power price, firmness, and timing will under-earn, or never energize.
Nuclear deserves a clear-eyed view. Existing reactors are valuable baseload and many can be uprated; keeping them online meaningfully reduces the amount of new firm capacity we must build. Small modular reactors could be a durable solution for large AI campuses in the 2030s, but the critical path is regulatory and supply-chain, not engineering. Markets expect pilot deployments in this decade and scale next, not a broad near-term solution. Meanwhile, advanced geothermal will matter at the margin where the resource exists and transmission permits, and hydrogen will be used 13 selectively for peaking or backup where economics clear—mostly in industrial parks, not core metros.
Hydro is the quiet workhorse. In the U.S. we won’t build many new big dams, but uprates, digital controls, and pumped-storage projects can add meaningful, flexible capacity. Globally, hydro remains under-utilized in parts of Africa and Southeast Asia; pairing that resource with fiber and modern grid controls is a development-scale opportunity.
This is where geography gets interesting. Energy-rich, tech-poor regions—from Azerbaijan’s gas basin to hydropower corridors in Central Africa to geothermal and hydro in Southeast Asia—can convert stranded or under-monetized resources into exportable compute, if (and it’s a big if) they can deliver three things: legal clarity over data and IP, credible power-purchase and interconnection regimes, and physical security. Compute is the first “manufacturing” export that ships over fiber. The arbitrage is real: if you can deliver 24/7 power with credible contracts at the right nodes, you can sell low-latency inference regionally and non-latency-sensitive training globally. Expect consortia—operators, energy developers, and sovereign capital—to move on this.
The private-capital signal is already flashing green. Blackstone’s multi-billion build-out through QTS and related platforms, and BlackRock’s ramp in energy and digital infrastructure, are simple tells: the returns are in marrying real assets (generation, wires, land, substations) with digital tenants on long-dated contracts. Every incremental gigawatt of compute pulls through turbines, transformers, switchgear, conductors, controls, heavy civil, thermal systems, and a trained workforce. The multiplier looks like traditional power plus the software stack—orders of magnitude beyond “just another warehouse.” That is why this is a macro story, not a tech niche.
Contrast the U.S. with China and the stakes sharpen. China builds transmission and generation faster, dominates solar modules and many battery inputs, and continues to add nuclear. It also controls critical links in the rare-earth magnet supply chain—neodymium and dysprosium for high-efficiency wind turbines and drive motors—with export policy as a tool. The U.S. leads in AI models, chips, and cloud software, but lags in permitting timelines, interconnection queues, transformer manufacturing, and ultra-high-voltage transmission. Closing that gap requires boring, executional policy: harmonized regional transmission planning, federal and state permitting reform with firm clocks, incentives for transformer and advanced conductor manufacturing, and clear rules that let corporate buyers contract for hourly, locational clean power. If we do that, private balance sheets will finance the rest.
Rare earths and materials are not footnotes to this thesis; they are the input deck. High-efficiency wind relies on rare-earth magnets; utility-scale solar is a glass, 14 aluminum, silver, and silicon business; every megawatt of new generation and every kilometer of new line is a copper story. Advanced packaging for AI chips is its own industrial policy issue. If we want resilient, low-cost power for compute, we need diversified supply in magnets, copper, transformers, and power electronics, or the constraint simply migrates upstream.
What are the second-order effects? Power-aware software will become an operating advantage; model efficiency work—retrieval, distillation, quantization, compilers, caching—translates directly into lower $/task and fewer required megawatts per unit of output. On the real-asset side, we’ll see new siting patterns: hybrid campuses with on-site generation and storage, dedicated HV substations, and fiber adjacency; more liquid and immersion cooling to fit higher-density racks within practical envelopes; and redesigned distribution systems to manage power-electronic loads without destabilizing feeders. The economics are straightforward: the operators who secure firm, reasonably priced power with credible in-service dates will compound; those who don’t will burn time and capital while their competitors get cheaper, smarter, and faster. Successful organizations are underwriting sites with a clear path to: (1) deliverable megawatts, (2) substation/line upgrades on a realistic schedule, (3) proven cooling/water plans, (4) firm land use entitlements, and (5) resilient transmission and contractual energy—or the capex never turns into compute. All of this leads to an infrastructure development that cuts across industries, geographies and demographics.
The takeaway is simple. If the 1890–1930 electricity boom was the original compute build-out, our version runs on electrons as much as models. Energy is not a side note—it’s the balance-of-system that determines whether AI becomes a productivity regime or a PowerPoint promise. The U.S. has the demand, the capital, and the software lead. If we match that with deliverable power—generation, wires, substations, and rules—we will convert this cycle into growth the way the last electricity boom did. If we don’t, someone else will.
Economic Transformation and Acceleration
The internet-to-AI transition exhibits an unprecedented compression of technological cycles. Whereas the railroad-to-electricity transformation unfolded over roughly 60 years (1840s–1900s), the internet-to-AI transition has taken barely 20 (1995–2020s). Network adoption and innovation now compound geometrically: broadband, mobile, and cloud adoption curves each halved the previous diffusion time.
AI’s macroeconomic potential echoes electricity’s: McKinsey Global Institute (2023) estimates that generative AI could add $2.6–$4.4 trillion in annual value to the global economy, roughly 1–2% of global GDP, comparable to the productivity gains attributed to electrification in the early 20th century (Gordon, 2016). Training compute demand has doubled every six months since 2012 (Epoch AI, 2024), while the cost of inference per FLOP has fallen over 90% in five years, producing deflationary effects similar to electricity’s impact on manufacturing costs in the 1920s.
AI also mirrors electricity’s diffusion pattern: first applied to specific industrial tasks (e.g., text and image generation, much as electric motors replaced steam engines), it is rapidly becoming a general-purpose technology embedded in every workflow, from logistics to finance. Its productivity impact, like electricity’s, scales non-linearly once supporting infrastructure—data pipelines, compute grids, and regulatory clarity—reach maturity.
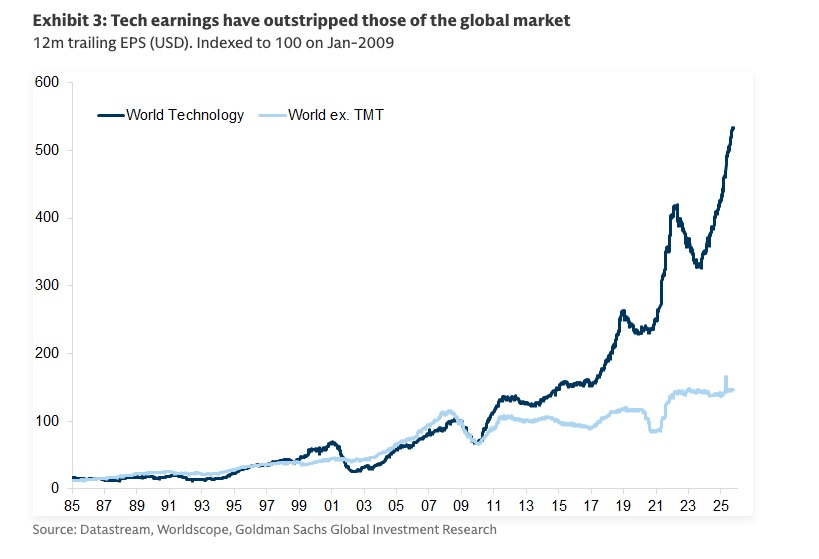
In fact, markets throughout the world are already demonstrating this productivity boom. If you simply look at where the actual earnings growth is coming from in public markets, it is nearly completely due to the “Technology” sector.
Modern Market Dominance and Adaptation
Rail barons like Cornelius Vanderbilt controlled 50-60% of key routes via the New York Central, while James J. Hill dominated northern lines with the Great Northern, building without subsidies for efficiency. Electricity pioneers Thomas Edison and George Westinghouse captured 10-15% of GDP-related sectors through the War of Currents, with Westinghouse’s AC system prevailing for scalability. These and others consolidated control of generation and transmission infrastructure.
These empires lasted decades, pivoting as needed—e.g., Union Pacific and GE endure today. Similarly, names like Bezos, Musk and Huang echo through the ages in the form of hyperscalers (Amazon, Microsoft, Google) and semiconductor leaders (Nvidia, TSMC) as they dominate compute and distribution layers. Tech giants like Apple and Amazon hold around 40% market shares in their sectors (e.g., smartphones, e-commerce), with combined market caps exceeding $10 trillion in 2025. Their capital intensity, economies of scale, and vertical integration mirror the utilities and manufacturers of the electrified age. Today’s giants have the luxury of being able to adapt faster via AI, integrating it into products for sustained dominance.
These entities now form the backbone of a new “digital grid.” Data centers function as substations; GPUs are the new dynamos; APIs are the transmission lines distributing compute power across industries. The result is an emerging AI economy where compute, not content, is the scarce resource—just as power generation, not appliances, was the bottleneck of the electrical era.
In this framework, the internet plays the role of the railroad: a vast, capital-intensive network that connects and distributes. AI plays the role of electricity: a transformative, 17 general-purpose technology that leverages that distribution to remake economies. The analogy is not merely poetic—it is structural and quantifiable. The same pattern repeats: infrastructure investment begets compute revolutions, which in turn unleash productivity booms and new market dominants.
This interplay—railroads accelerating electricity through adoption and logistics, and electricity supercharging rails’ impact—created compounding effects, compressing innovation cycles and driving the Industrial Revolution’s second phase. References: David (1990) Technical Choice, Innovation and Economic Growth; Fishback & Kantor (1996) The Journal of Economic History; Gordon (2016) The Rise and Fall of American Growth; HistoryNet (2023); Manyika et al. (2013) McKinsey; Middleton (2001) The Time of the Trolley; Trains Magazine (2009, 2024); U.S. DOT (1977); Wikipedia (2024).
In parallel, the internet emerged in the 1990s as a disruptive digital distribution network, with fiber optics and telecom infrastructure mirroring railroad tracks by hauling data packets globally at unprecedented speeds. This backbone has enabled AI, which acts as the modern equivalent of electricity—providing computational “juice” to power applications in warehouses, autonomous vehicles, and healthcare. Without broadband and data centers, AI would be confined to laboratories; instead, it leverages the internet’s reach to process petabytes of data overnight, driving innovations like real-time predictions and personalized services.
Both historical and contemporary pairings follow a rhythm: massive upfront investment in distribution, followed by a power layer that unlocks exponential value. Railroads shrank economic distances, reducing transport times from weeks to days; electricity enabled non-stop factories. Today, the internet has dropped information transfer costs to near-zero, while AI accelerates R&D and decision-making, potentially compressing innovation cycles further.
Timelines of Adoption and Scale
Railroad construction in the U.S. began in the 1830s with lines like the Baltimore & Ohio, culminating in the 1869 transcontinental railroad. By the 1880s, the network scaled to around 40,000 miles, tripling to over 120,000 miles by 1890. By 1900, railroads handled 80% of long-haul freight, though daily ridership was only about 10% of the population, as it was primarily industrial rather than personal tech.
Electricity followed, with Edison’s first power plant in 1882. Grid access reached 20% of homes by 1920 (about 40 years from inception) and 90% by 1950 (70 years total for ubiquity). Railroads accelerated this by funding early grids in rail towns and using electricity for signals and operations, extending adoption to urban areas.
The internet’s timeline accelerated dramatically. While ARPANET dates to 1969, the commercial boom started in 1990 with web browsers. By 2005—just 15 years later—65% of U.S. households were online, driven by falling hardware costs and infrastructure build-outs.
AI’s breakthrough is often pegged to 2017 with advances in GPU’s and then the release of ChatGPT and large language models in 2022, the “Netscape moment”. Projections suggest meaningful adoption, such as 50% of workforce tools by 2035 (18 years post-breakthrough), though some estimates indicate 30-60% of jobs could be automated or transformed by 2030-2040. If hardware advancements continue, this could shorten to 12 years, reflecting compounding progress where each layer builds on the last.
Bottom line: Cycles are compressing—railroads took 50 years for core economic integration, electricity another 50 for households, the internet 15 for mass adoption, and AI potentially 15-20, as distribution costs fall and computational power rises exponentially.
Economic Impact
Railroad capital expenditures totaled about $12 billion nominally by 1900, equivalent to roughly $350 billion to $463 billion adjusted for inflation. Electricity infrastructure from 1880-1930 cost $6 billion nominally, or about $150 billion adjusted. These investments 19 lowered costs dramatically: railroads reduced shipping by 20-50%, stabilizing inflation and boosting GDP per capita by 200% from 1900-1940 through enhanced productivity.
Internet infrastructure in the 1990s saw about $1.5 trillion nominal globally (around $4 trillion adjusted), funding cables, servers, and data centers. This slashed communication costs to near-zero, contributing 3.4% to GDP in major economies and enabling faster R&D.
AI investments are projected in the trillions, with potential to add 1.5% to GDP by 2035 through labor productivity gains. It slashes R&D timelines, for instance accelerating drug discovery by up to 70% via data analysis and predictive modeling, reducing costs and time-to-market. Overall, these layers drive deflationary efficiencies: rail/electricity flattened prices despite growth, while internet/AI optimize supply chains and innovation, multiplying output.
Enhanced Perspective on the Scale of 19th-Century Railroad Investments
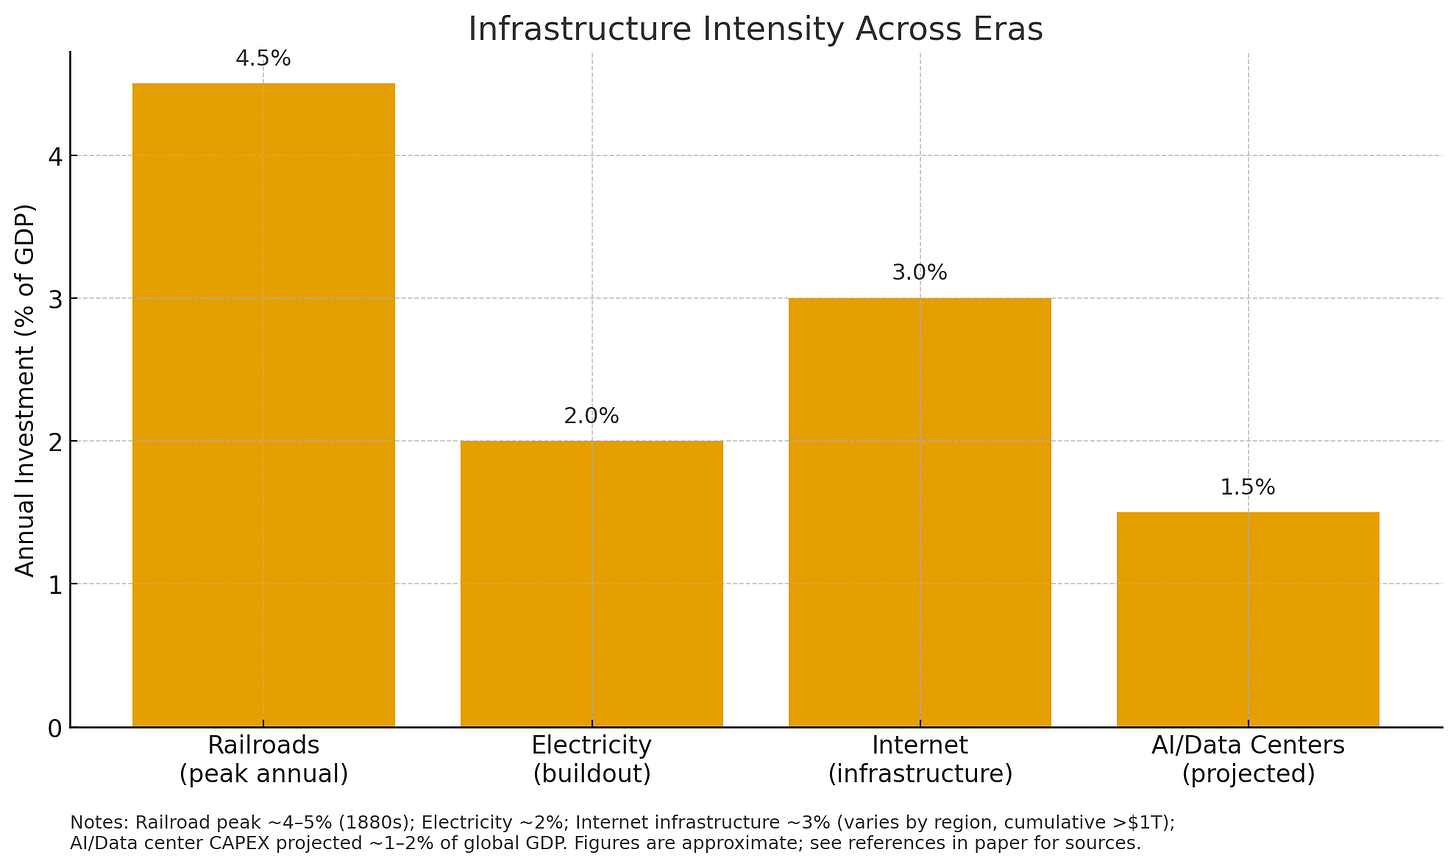
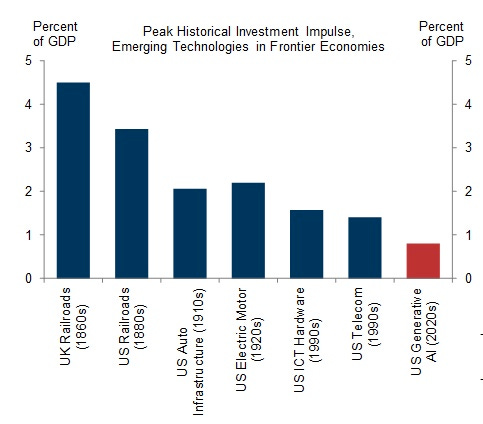
To gain a more accurate understanding of the scale of 19th-century U.S. railroad investments—beyond simple inflation adjustment—it’s useful to contextualize the nominal figures relative to the size of the economy at the time (e.g., as a percentage of GDP) and the broader landscape of infrastructure spending. Below, I break this down using historical data from reliable sources like the U.S. Census Bureau’s Historical Statistics of the United States and MeasuringWorth.com Verified Nominal Investment Figure In the figure below, you will note that the current Gen-AI and Data Center spend is still just projected to reach 1.5% of GDP. Still far below the peak of the Rails boom at 4.5%.
Inflation-Adjusted Equivalent
Using the Consumer Price Index (CPI) from the U.S. Bureau of Labor Statistics, $12 billion in 1900 dollars equates to a number as high as approximately $440–$463 billion in 2023 dollars (inflation factor of ~36.7–38.6, depending on the exact endpoint; BLS, 2024; MeasuringWorth, 2024). But, for a more economic perspective, using relative share of GDP as the adjustment method (which accounts for growth in overall output), $12 billion in 1900 would be equivalent to about $3.2 trillion today—reflecting how much larger the modern U.S. economy is (MeasuringWorth, 2024).
As a Percentage of U.S. GDP
Comparing the investment to GDP provides context on its economic magnitude, as GDP measures the total annual output of goods and services. Cumulative Capital Stock vs. Annual GDP (1900): U.S. nominal GDP in 1900 was $21.2 billion (MeasuringWorth, 2024). Thus the $12 billion cumulative railroad CapEx represented about 57% of that year’s GDP. This highlights the railroads’ dominance: by 1900, the invested capital in railroads alone was equivalent to half the nation’s annual economic output, underscoring their role as the era’s largest industrial asset (comparable to tech giants’ market caps today as a share of GDP). 21 Annual Investment as % of GDP (Peak Periods): Cumulative figures are stock measures, so annual flows (new investments) offer a better “spend” perspective. During the 1880s boom, annual railroad capital expenditures averaged ~$547 million (derived from capital stock growth from $4.7 billion in 1880 to $10.1 billion in 1890; U.S. Census Bureau, 1960, Series K 18-27). With average annual GDP of ~$12 billion in the 1880s, this equated to ~4.6% of GDP per year. In earlier peaks (e.g., 1868–1873 post-Civil War surge), annual investments reached ~$340 million, or ~4–5% of GDP (GDP ~$7–8 billion annually; Fishlow, 1965). For comparison, modern U.S. infrastructure spending (all categories) is about 2.5–3.5% of GDP annually (CFR, 2023), making 19th-century railroad investments proportionally larger during booms. These percentages illustrate the immense economic commitment: railroads absorbed a significant portion of national savings and foreign capital, driving growth but also contributing to financial panics (e.g., 1873, 1893) when overinvestment occurred.
As a Share of Total U.S. Infrastructure Spend
In the late 19th century, railroads dominated infrastructure investment, which was largely private rather than government-funded (unlike today). Total U.S. infrastructure spending (including canals, roads, ports, and early utilities) is harder to pinpoint precisely, but estimates suggest it was around 5–7% of GDP annually during the 1870s–1890s, with railroads comprising 60–80% of that (Gallman, 1966; NBER, 1975). For example: ● Cumulative railroad investment by 1900 ($12 billion) likely represented ~70–80% of all cumulative infrastructure capital stock (~$15–17 billion total, including public works like canals at ~$1 billion and roads at ~$2–3 billion; U.S. DOT, 1977). ● Annually, government public infrastructure spend (federal/state/local on non-rail items) was ~1–2% of GDP, while private railroad spend added another 3–5%, totaling 4–7% (Cato Institute, 2013; based on historical budget data). Railroads were the “massive distribution network” precisely because of their ubiquity and they dwarfed other infrastructure: canals peaked at ~$1 billion cumulative by 1860 (mostly pre-rail), and federal road spending was minimal until the 20th century (e.g., <0.5% of GDP; Wilson Center, 2021).
Key Insights and References
This scale—4–5% of GDP annually during peaks and ~50–60% of annual GDP in cumulative stock—dwarfs modern equivalents such as the current Gen-AI boom at still under 1% of GDP, and the 2021 Infrastructure Investment and Jobs Act authorized ~0.5% of GDP annually. It fueled GDP growth (adding ~1–2% annual productivity gains; Donaldson & Hornbeck, 2016) but required massive foreign borrowing (20–30% of funding from Europe). Without this, electrification and industrialization would have been delayed.
This contextualization shows the railroads’ investment was not just large in absolute terms but economically transformative, equivalent to betting half the nation’s yearly output on a single sector. Most estimates today are for global data center capex to reach ~1–2% of world GDP annually.
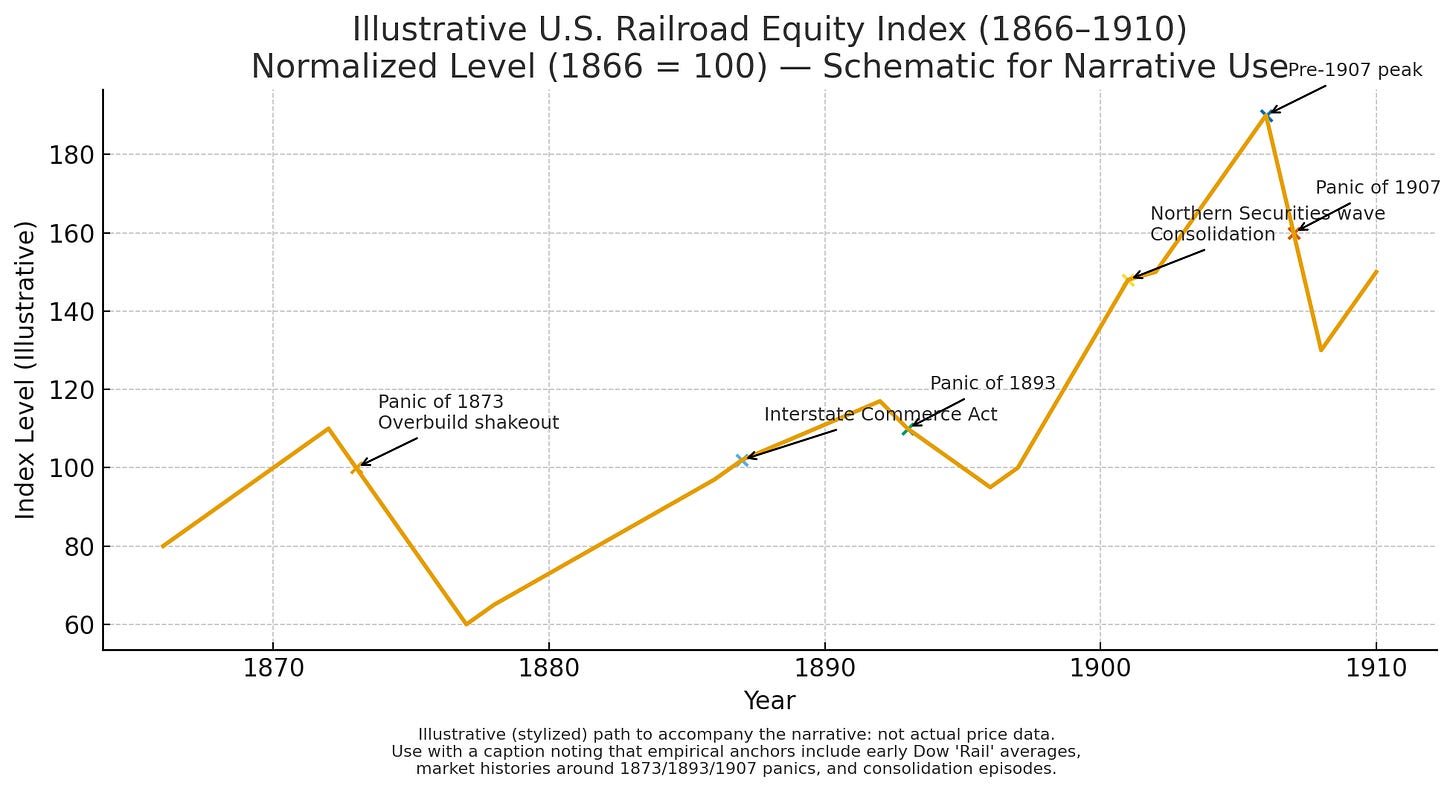
As mentioned above, these massive investment cycles came with payback. Rail stocks were hammered after 1873 in that year’s Market Panic. All equities were a poor place to hide in the immediate aftermath. But that’s typical of a cycle, not a verdict on the asset class. The immediate trigger of that 1873 Market Panic was the failure of Jay Cooke & Co. after it choked on Northern Pacific financing. They were the government’s former Civil War bond house and the main underwriter for the Northern Pacific Railroad, and they failed when it couldn’t sell more NP bonds and meet deposit withdrawals.In the late 1860s–early 1870s, the U.S. financed thousands of new track-miles with heavy leverage (land grants, bonds sold to the public and in Europe). Revenues lagged the pace of construction and markets called the markets n their bluff. The underlying cause was a classic capital-cycle setup: years of overinvestment in railroads financed by easy credit and massive leverage, followed by credit tightening and a loss of confidence that forced a sudden stop. The 1880s–1900s brought consolidation, dividend-paying blue chips, and a renewed rail bull market captured in the early Dow “railroad” averages. Investors who owned survivors or bought the reorganizations did fine; many bondholders did better. A chart stopping in the mid-1870s misses the second act that financed America’s industrial scale-up.
Conclusion:
When Connectivity Meets Compute History doesn’t repeat—but it rhymes. The railroads connected space; the internet connects information. Electricity powered machines; artificial intelligence now powers decisions. Every great technological revolution follows this same rhythm: a vast distribution network is built, and then a new form of compute transforms what that network carries.
The railroads and electricity together industrialized matter; the internet and AI together are industrializing thought. Both cycles required immense capital, produced deflationary abundance, and concentrated influence among those who built the underlying grid. Owning the grid remains powerful; but going forward, compounding returns will concentrate where firms are AI-native and can also convert grid power & access into learning and workflow automation.
In the 19th century, value accrued to the railroad and power magnates who controlled the flow of energy and goods. In the 21st, it will accrue to the hyperscalers, chipmakers, and infrastructure builders who control the flow of data and compute. This is not a replay of the dot-com bubble—it is the structural replay of the advent of Electricity in the Industrial Revolution. The infrastructure phase of the digital era is being completed; the intelligence phase is just beginning. This is the “New Era”!
It must be noted that human nature is unchanging. We are especially adept at seizing upon booms and pushing them to their extreme. The Boom/Bust cycles are always bigger than the last and always bigger than most think. Overconfidence, runaway optimism and most importantly leverage and tightening credit are the markings of a death knell for Booms. As of September 2025, we have not seen the large leverage in 25 the system nor the credit markets tightening. In fact, the US Federal Reserve is easing credit policy, not tightening. If these change, then our view may change.
In addition, pay attention to the past boom cycles, where frequently the “first movers”, or leaders that began the cycle did not always end up being the leaders over time. The winners won’t be “infrastructure only” or “applications only,” but the companies that are AI-native—those that wire AI into product, data, decisions, and capital allocation with conviction. We see it as vital to only back firms that treat AI as core to their business model, not a feature: proprietary data flywheels, automated workflows end-to-end, continuous model deployment, and orgs designed to compound learning. In this cycle, AI-native beats AI-adjacent.
Consider real-world examples from 2025: OpenAI’s ChatGPT is the fastest growing product in the history of the world. Remarkably the large majority of their users are non-US!. Microsoft has embedded AI across its ecosystem, from Azure’s intelligent cloud (up 20% YoY in Q4 FY2025) to Copilot tools adopted by nearly 75% of Fortune 500 firms, driving $46.7 billion in quarterly revenue and positioning it as an AI-native leader. Amazon, committing $100 billion+ to AWS AI expansions and its key Anthropic partnership, has become AI-native in e-commerce and logistics, with generative AI contributing “multiple billions” annually and boosting efficiency by 70% in supply chains. Netflix, an early AI adopter for recommendations, saw subscriber growth accelerate to 277 million in 2025, the company has attributed up to 15% of engagement uplift to AI-driven personalization. Smaller firms have thrived by enabling AI-native workflows, helping enterprises like Allstate reduce fraud detection time by 50% through committed AI integration. Even in manufacturing, Siemens has invested $10 billion in AI-native factories, yielding 30% productivity gains via predictive maintenance. Thomson Reuters’ 2025 study reinforces this: Firms with comprehensive AI strategies are twice as likely to achieve revenue growth, emphasizing conviction over piecemeal adoption.
These successes stem from treating AI as native to the business—redesigning processes, upskilling teams, and investing decisively across infrastructure (e.g., data centers powering 123 gigawatts by 2035 in the U.S.) and applications (e.g., AI-native software adding $2.6–$4.4 trillion in annual value by 2030). App-centric bets can succeed if AI-native (e.g., Anthropic’s enterprise tools generating $500M+ ARR), but without full commitment, they risk commoditization. Investors and leaders who commit with conviction—fostering AI-native cultures—will capture the theme’s full potential, accelerating growth in an era where AI redefines competition. When connectivity meets compute, economies don’t merely evolve—they accelerate. AI is not electricity’s descendant; it is its reincarnation.
Reshared from my personal Substack: https://davidjlaplaca.substack.com/p/every-era-rewires-its-world-today?r=39w8z
Comments