As many of you know, the team at Intellectus Partners has been working on and refining a number of Quantitative driven analytics. Today we release our proprietary economic algorithmic indicator, which we have coined the "IntelleCator". We take this opportunity to further expand upon our findings and methodology.
The idea is that our economic indicator will enable the team to have a nearly real-time pulse on the health of the broader economy. This in turn, will provide us a clearer perspective on how to best position our assets, depending upon our Macro views. If we believe that we are currently in a "Growth", "Recessionary", or "middling" environment the Intellecator algo helps drive our thinking. Essentially it will allow us to make better decisions related to whether we should be on offense, "Risk On" or defense, "Risk Off".
We are running this algorithmic model for the major developed economies of The United States, the European Union / Eurozone, and Japan currently. The focus will be on the U.S. version of the Intellecator in this post.
Our methodology is to closely track and monitor what we consider to be the most important economic datapoints for each region; some of which are leading indicators, some are lagging indicators and some are coincident indicators. Examples of components of the indicator would include: Purchasing Managers Index, Financial Conditions, Payrolls, Durable Goods, etc. We then assign weightings to each ofour chosen data points, in order to come up with a rating. Testing shows that this gives us a good sense of the current health of the economy. The image below will provide an idea of the inputs & outputs for our model.
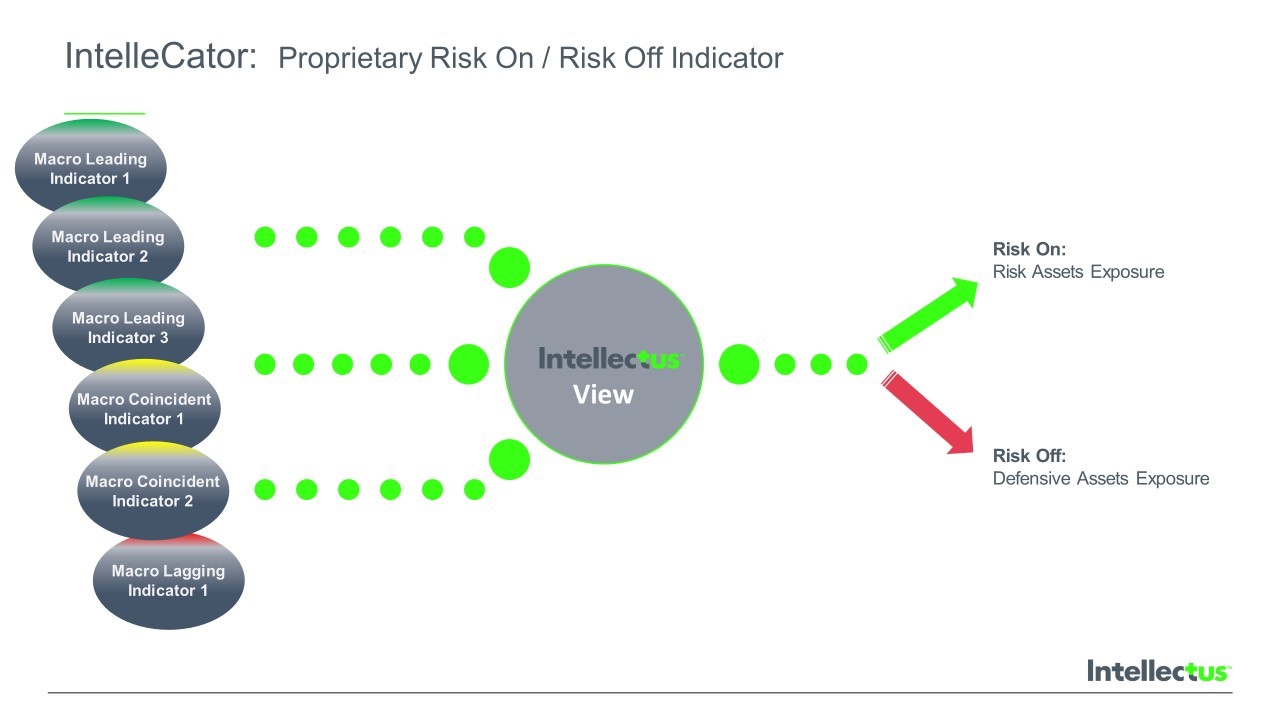
The Intellecator signal is derived by our scoring model, which is driven by the weightings and importance we place upon each piece of economic data. If the indicator produces a very high rating or "score", then it should be a good environment to be on offense & to have exposure to Risk Assets, and vice versa. The scale for our Intellecator scoring model is simplified, as follows:
Above 5 = Growth Economy - Green
Between 1 to 5 = Middling Economy - Yellow
Below 1 = Recessionary Economy - Red
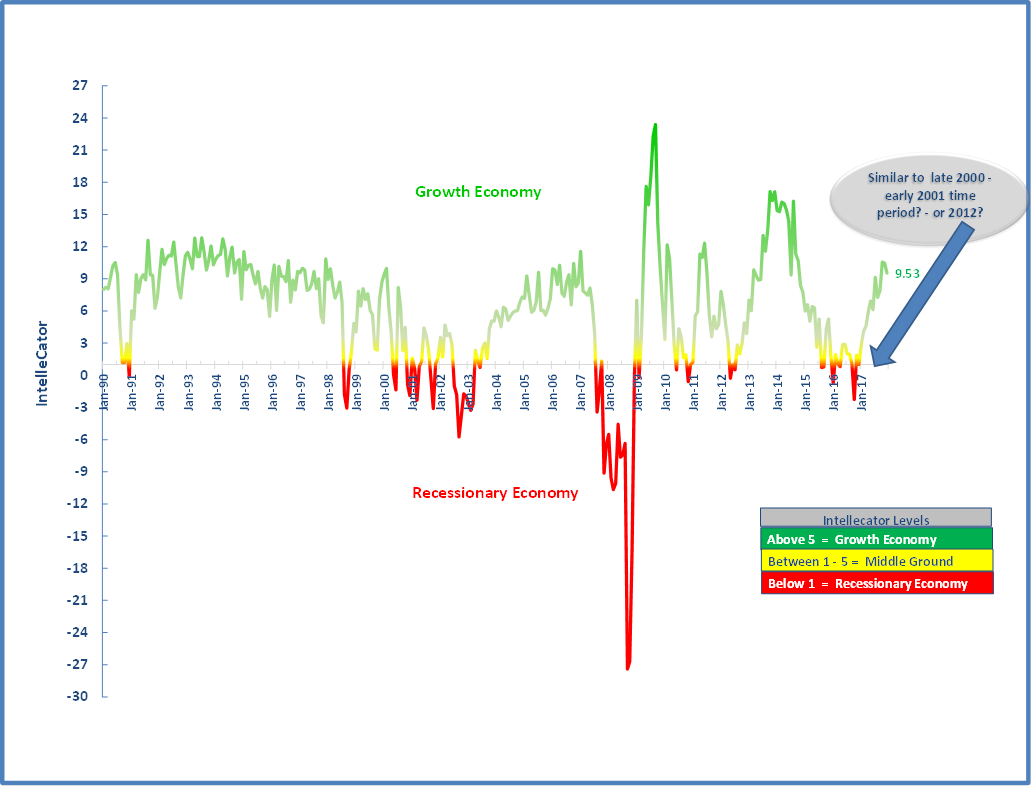
You can see in the image below the current IntelleCator score and the historical trend of the signal as well. This data goes through the end of 2017, as most of the datapoints that we track come out on a monthly basis. You will notice that there were several negative (score of +1 to -1) readings in mid to late 2016, which does concern us. However, the signal started to improve significantly (from +1 to +9) from the beginning of 2017 through the end of 2017. This uptick has obviously already been reflected in the general equity markets, and "what happens next" is the more important thought to wrap our heads around. So the main question now, as related to this algo, would be if we are in a period that is more similar to: a) Late 2000 to early 2001 or b) Late 2012
If we are in a period similar to late 2012, then all is well, but if the data has deteriorated sharply in the last 40 days, and we get back down to the Red zone on our Intellecator then we have to be much more careful and protect against the possibility of markets rolling over in anticipation of a more pronounced slowdown in the overall economy. We know that Financial Conditions are likely tightening during the latest events, but this is just one component in our model.
Given the recent volatility in the equity markets, we will certainly be watching all of the data very closely and provide more frequent updates as we see movement in the direction of the Intellecator.
Of course, if you feel that this is something that you would like to learn more about, let us know. As always, feedback is welcome & appreciated. Please reach out to us if you have questions, comments or would like to dig in a bit deeper on our methodologies. We can be reached at info@intellectuspartners.com, just leave a question, comment and contact info.
Comments